

Assessing infants' cortical response to speech using near-infrared spectroscopy
- PMID: 17045812
- PMCID: PMC1783837
- DOI: 10.1016/j.neuroimage.2006.08.010
Assessing infants' cortical response to speech using near-infrared spectroscopy
Abstract
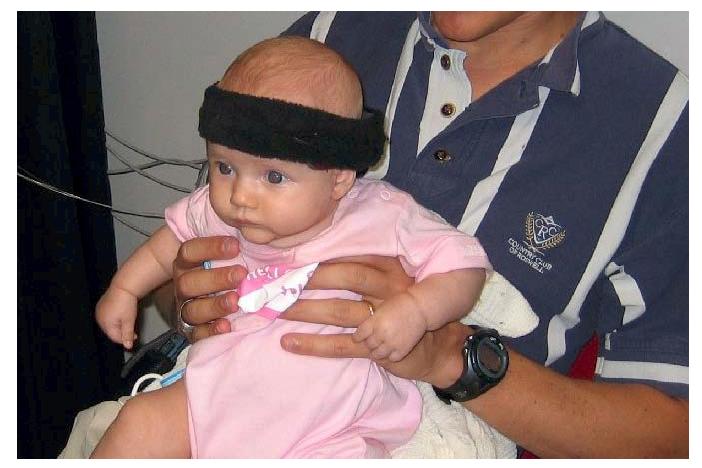
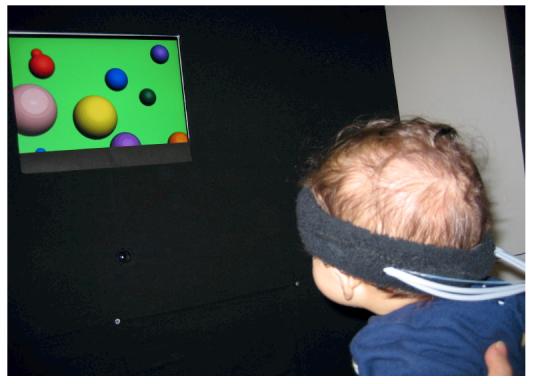
Sensitivity to spoken language is an integral part of infants' formative development, yet relatively little is known about the neural mechanisms that underlie the emerging ability to perceive and process speech. This is in large part because there are a limited number of non-invasive techniques available to measure brain functioning in human infants. Near-infrared spectroscopy (NIRS), an optical imaging technique that estimates changes in neuronal activity by measuring changes in total hemoglobin concentration and oxygenation, may be a viable procedure for assessing the relation between speech processing and brain function in human infants. While auditory processing data have been gathered from newborn and preterm infants using NIRS, such data have not been collected from older infants. Many behavioral measures used to establish linguistic sensitivity in this population are accompanied by visual stimuli; however, it is unclear how coupling of auditory and visual stimuli influences neural processing. Here we studied cortical activity in infants aged 6-9 months, as measured by NIRS, during exposure to linguistic stimuli paired with visual stimuli and compared this to the activity observed in the same regions during exposure to visual stimuli alone. Results dissociate infants' hemodynamic responses to multimodal and unimodal stimuli, demonstrating the utility of NIRS for studying perceptual development in infants. In particular, these findings support the use of NIRS to study the neurobiology of language development in older infants, a task that is difficult to accomplish without the use of attention-getting visual stimuli.
Figures


References
-
- Baird AA, Kagan J, Gaudette T, Walz KA, Hershlag N, Boas DA. Frontal lobe activation during object permanence: Data from near-infrared spectroscopy. NeuroImage. 2002;16:1120–1126. - PubMed
-
- Bartocci M, Winberg J, Ruggiero C, Bergqvist LL, Serra G, Lagercrantz H. Activation of olfactory cortex in newborn infants after odor stimulation: A functional near-infrared spectroscopy study. Pediatric Research. 2000;48:18–23. - PubMed
-
- Bartocci M, Winberg J, Papendieck G, Mustica T, Serra G, Lagercrantz H. Cerebral hemodynamic response to unpleasant odors in the preterm newborn measured by near-infrared spectroscopy. Pediatric Research. 2001;50:324–330. - PubMed
-
- Boas DA, Franceschini MA, Dunn AK, Strangman G. Noninvasive imaging of cerebral activation with diffuse optical tomography. In: Frostig RD, editor. In Vivo Optical Imaging of Brain Function. CRC Press; Boca Raton: 2002. pp. 193–221. - PubMed
-
- Calvert GA. Crossmodal processing in the human brain: Insights from functional neuroimaging studies. Cerebral Cortex. 2001;11:1110–1123. - PubMed
Publication types
MeSH terms
Grants and funding
LinkOut - more resources
Full Text Sources
