. 2006 Oct 19;52(2):247-54.
doi: 10.1016/j.neuron.2006.07.028.

Spontaneous retinal activity mediates development of ocular dominance columns and binocular receptive fields in v1

Affiliations

Spontaneous retinal activity mediates development of ocular dominance columns and binocular receptive fields in v1

Andrew D Huberman et al. Neuron. .

Abstract

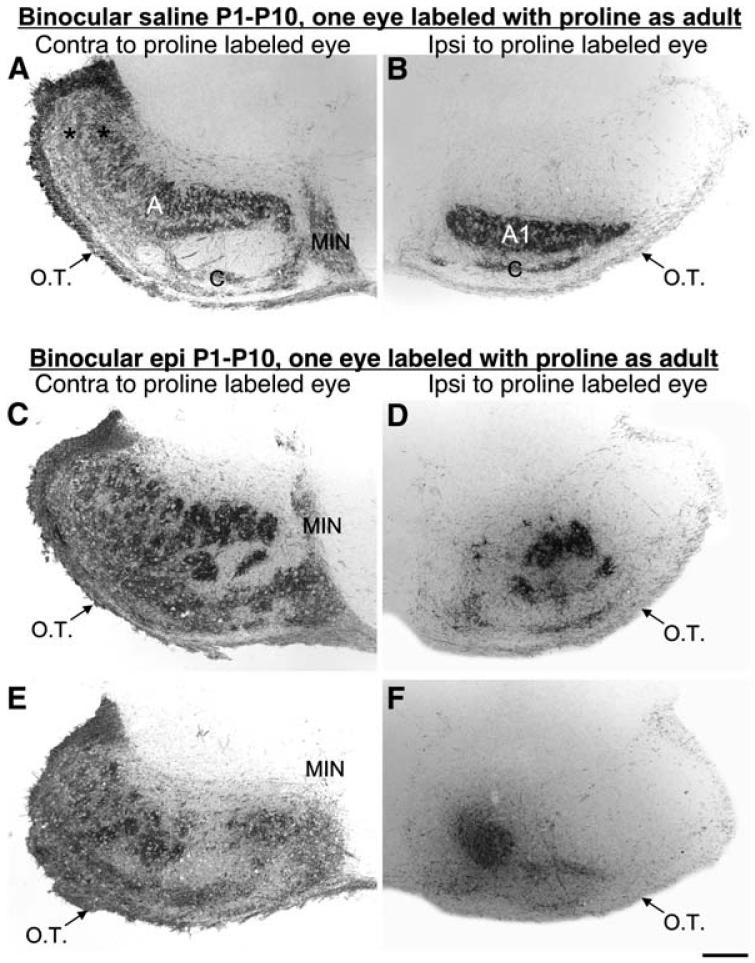
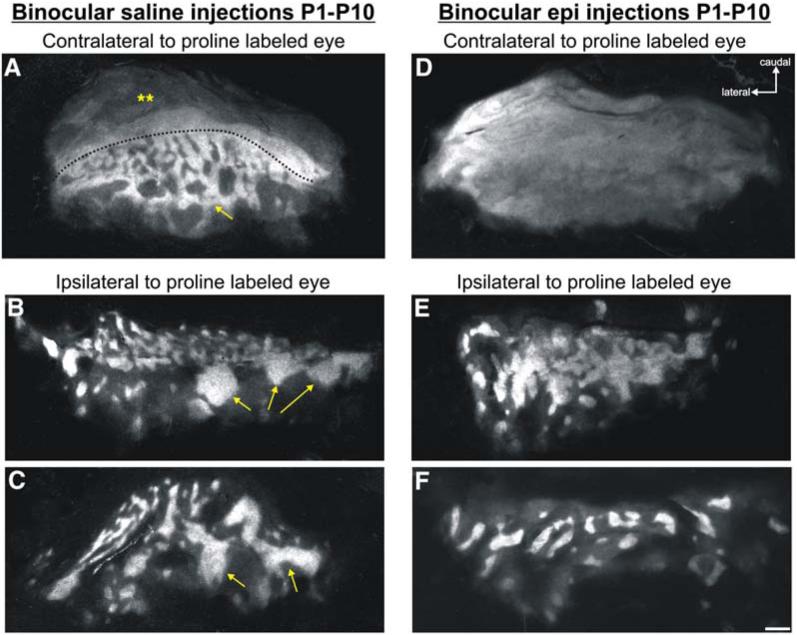
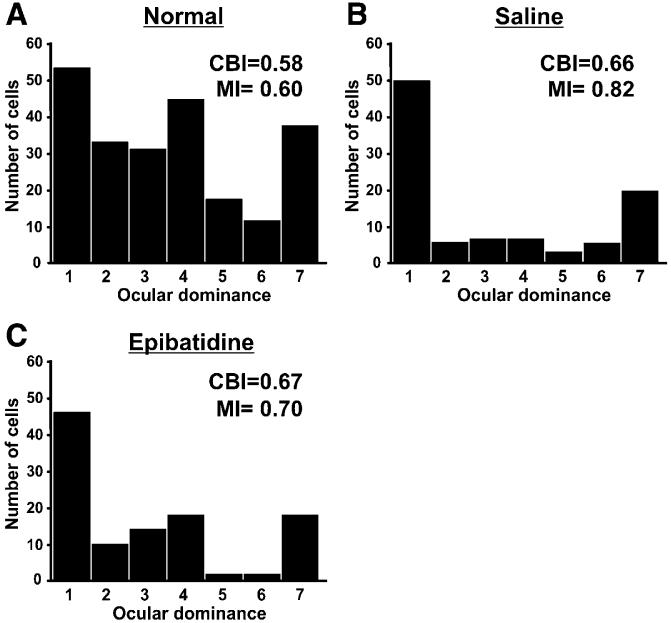
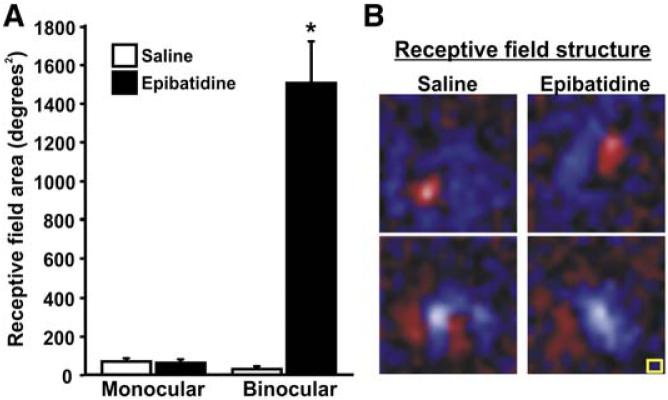
The mechanisms that give rise to ocular dominance columns (ODCs) during development are controversial. Early experiments indicated a key role for retinal activity in ODC formation. However, later studies showed that in those early experiments, the retinal activity perturbation was initiated after ODCs had already formed. Moreover, recent studies concluded that early eye removals do not impact ODC segregation. Here we blocked spontaneous retinal activity during the very early stages of ODC development. This permanently disrupted the anatomical organization of ODCs and led to a dramatic increase in receptive field size for binocular cells in primary visual cortex. Our data suggest that early spontaneous retinal activity conveys crucial information about whether thalamocortical axons represent one or the other eye and that this activity mediates binocular competition important for shaping receptive fields in primary visual cortex.


Figures

Figure 1
Figure 1. Eye-Specific Retinogeniculate Projections Are Segregated, but Their Patterning Is Altered in Epi-Recovery Ferrets
(A-F) Photomicrographs of the pattern of proline labeling of retinal axons in horizontal sections through the mature ferret LGN. Scale bar, 1 mm. O.T., Optic Tract. MIN, medial intralaminar nucleus. Rostral is toward the top, and medial is toward the center of each panel. ([A], [C], and [E]) Contralateral and ([B], [D], and [F]) ipsilateral to the proline-injected eye of control ([A] and [B]) and epi-recovery ([C]-[F]) ferrets. (A) In the control contralateral LGN, normal A and C layers (retinal afferent termination zones) are labeled. (B) In the control ipsilateral LGN, layers A1 and C are clearly seen as well. ([C]-[F]) In the LGN of epi-recovery ferrets, patchy, variable patterned retinal inputs are always seen. For further explanation of the anatomy and physiology of the LGN in epi-recovery ferrets, see Huberman et al. (2002).
Figure 2
Figure 2. Ocular Dominance Columns Are Perturbed in Adult Ferrets that Lack Spontaneous Retinal Activity from P1 to P10
(A-F) Flat-mount reconstructions of the entire thalamocortical ODC map in layer 4 of V1 from ([A]-[C]) control ferrets and ([D]-[F]) epi-recovery ferrets. Brightly labeled regions are the LGN axons representing the proline-injected eye. (A) In control ferrets, contralateral cortex shows a large monocular region (double asterisks) in caudal V1. The slight modulations in signal intensity (dimmer in the more caudal regions) are the result of varying ganglion cell densities across the central versus peripheral retina, which affects the amount of tracer uptake and transport. Nevertheless, the entire monocular zone is labeled. Anterior to the dashed line are clearly delineated ODCs (alternating pattern of white/black label) that arise from axons in layer A (labeled) and A1 (unlabeled) in the LGN. Further anterior lie the rostral eye bands (arrow) characteristic of ferret ODC maps. (B and C) ODC maps in the ipsilateral cortex from two different control ferrets. Alternating ODCs are readily seen. Anteriorly, the thick rostral eye bands are seen (arrows). (D) Proline label in the contralateral cortical hemisphere of an epi-treated ferret. The proline label is continuous and no ODCs are evident. (E) Ipsilateral hemisphere of an epi-recovery ferret. ODCs are wider and their borders are less distinct than in those of controls. (F) Ipsilateral hemisphere of another epi-recovery ferret. ODCs appear distinct, but are further apart and wider than normal, and there is no evidence of the rostral eye bands characteristic of normal ferrets. Scale bar, 1 mm.
Figure 3
Figure 3. Ocular Dominance Histograms of Control and Activity-Blocked Ferrets
(A-C) Histograms of the number of cells per OD category recorded in (A) normal, (B) P1-P10 saline-injected, and (C) P1-P10 epi-injected adult ferrets. The 1-7 category OD metric was applied to determine whether a given cell in V1 was responsive to the contralateral eye only (category 1 cells), the ipsilateral eye only (category 7 cells) or to varying degrees, to both eyes (category 2-6 cells). Category 4 cells respond equally to both eyes (Hubel and Wiesel, 1962; Issa et al., 1999). The pooled contralateral bias index (CBI) and monocularity index (MI) is shown for each group. The CBI and MI of these groups are not significantly different from normal ferrets or each other. (CBI: normal versus saline, p > 0.55; normal versus epi, p > 0.55; epi versus saline, p > 0.55. MI: normal versus saline, p > 0.40; normal versus epi, p > 0.55; saline versus epi, p > 0.85.) (Normal, n = 5 hemispheres; saline, n = 4 hemispheres; epi, n = 3 hemispheres; Mann-Whitney U test).
Figure 4
Figure 4. Spontaneous Retinal Activity Blockade Increases Receptive Field Size for Binocular V1 Neurons
(A) Mean receptive field size for monocular V1 cells is not significantly different for epi-recovery ferrets compared with saline-injected controls (mean saline-injected monocular receptive field area = 79.77 degrees2 ± 9.34, n = 70 cells; mean epi-recovery monocular receptive field area = 73.27 degrees2 ± 10.78, n = 64 cells; p = 0.64 for saline versus epi, Student's t test), and is within normal range of previously reported values (Law et al., 1988). The size of receptive fields for binocular cells in V1 of epi-recovery ferrets, however, is dramatically increased (mean epi-recovery binocular receptive field area = 1514.69 degrees2 ± 206.64, n = 42 cells; mean saline-injected binocular receptive field area = 41.00 degrees2 ± 6.95, n = 28 cells; p < 0.00001 for saline versus epi, Student's t test). (B) Maps of receptive field structure obtained with m-sequence reverse correlation mapping for monocular V1 cells in control and epi-recovery ferrets. Normal response profiles, orientation bias, and spatial organization of receptive fields are seen in monocular V1 cells from both groups. Areas of the receptive fields of the cells excited by light stimuli (On subregions) are shown in red, and areas excited by dark stimuli (Off subregions) are shown in blue. Brightness corresponds to the strength of the responses of the cells. Yellow square, 2 × 2 degrees of visual angle. Error bars = SEM.

Comment in

Similar articles

Cited by

References

    1. Adams DL, Horton JC. Capricious expression of cortical columns in the primate brain. Nat. Neurosci. 2003;6:113–114. - PubMed
    1. Adams DL, Horton JC. Monocular cells without ocular dominance columns. J. Neurophysiol. 2006 in press. Published online July 19, 2006. 10.1152/jn.00131.2006. - PubMed
    1. Cang J, Renteria RC, Kaneko M, Liu X, Copenhagen DR, Stryker MP. Development of precise maps in visual cortex requires patterned spontaneous activity in the retina. Neuron. 2005a;48:797–809. - PMC - PubMed
    1. Cang J, Kaneko M, Yamada J, Woods G, Stryker MP, Feldheim DA. Ephrin-as guide the formations of functional maps in the visual cortex. Neuron. 2005b;48:577–589. - PMC - PubMed
    1. Chapman B. Necessity for afferent activity to maintain eyespecific segregation in ferret lateral geniculate nucleus. Science. 2000;287:2479–2482. - PMC - PubMed

Publication types

MeSH terms