. 2006 Oct 19;52(2):371-81.
doi: 10.1016/j.neuron.2006.08.009.

Experience-dependent adult cortical plasticity requires cognitive association between sensation and reward

Affiliations

Experience-dependent adult cortical plasticity requires cognitive association between sensation and reward

David T Blake et al. Neuron. .

Abstract

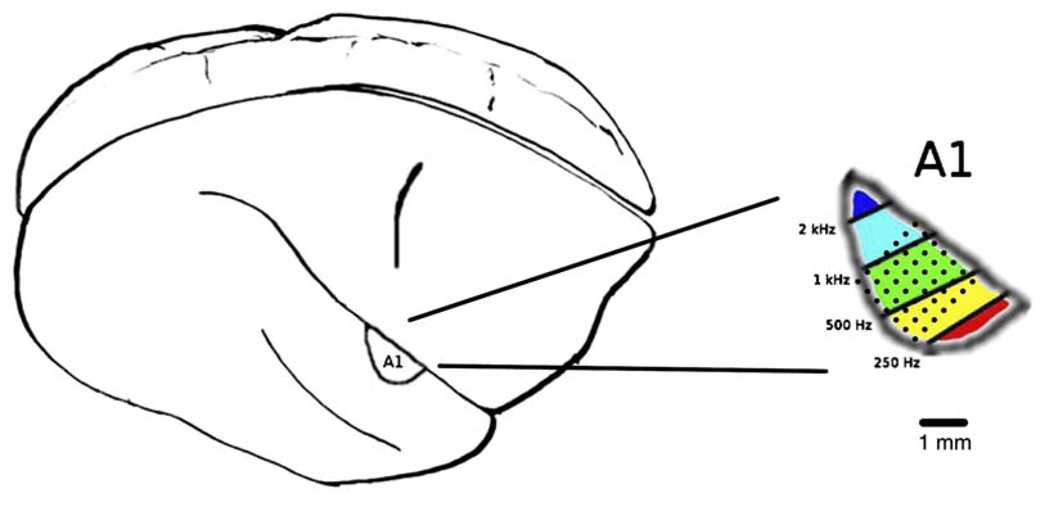
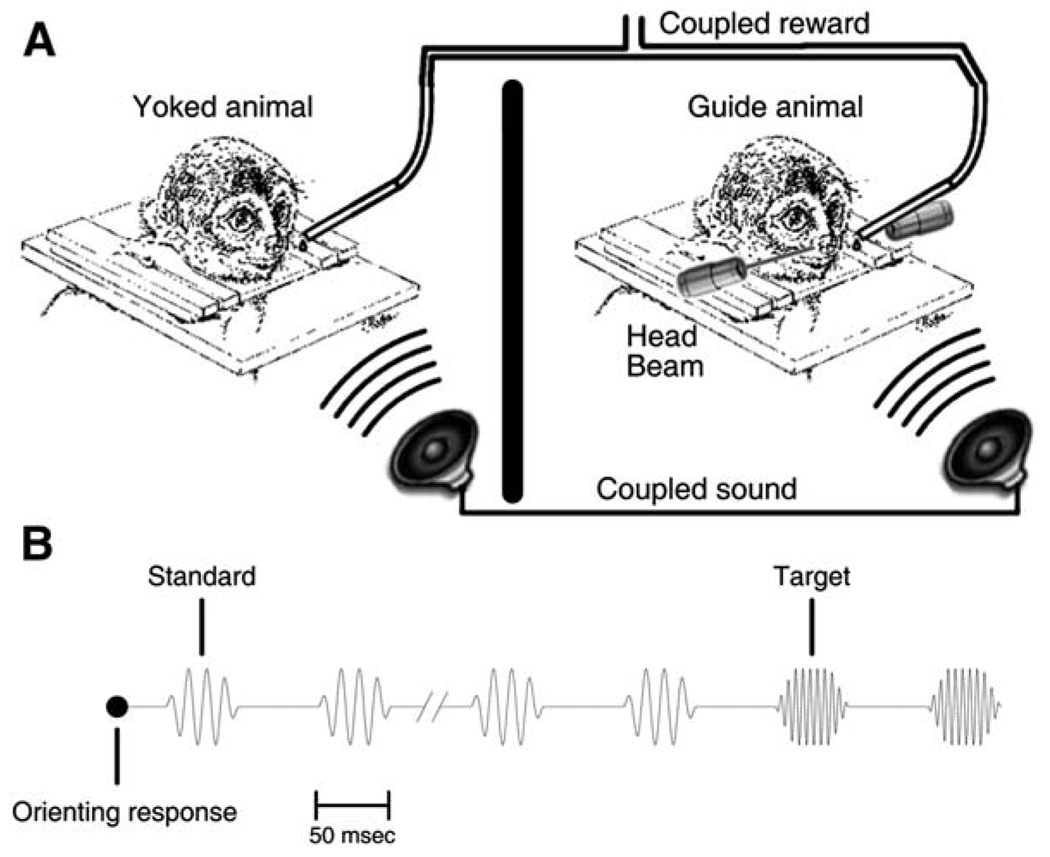
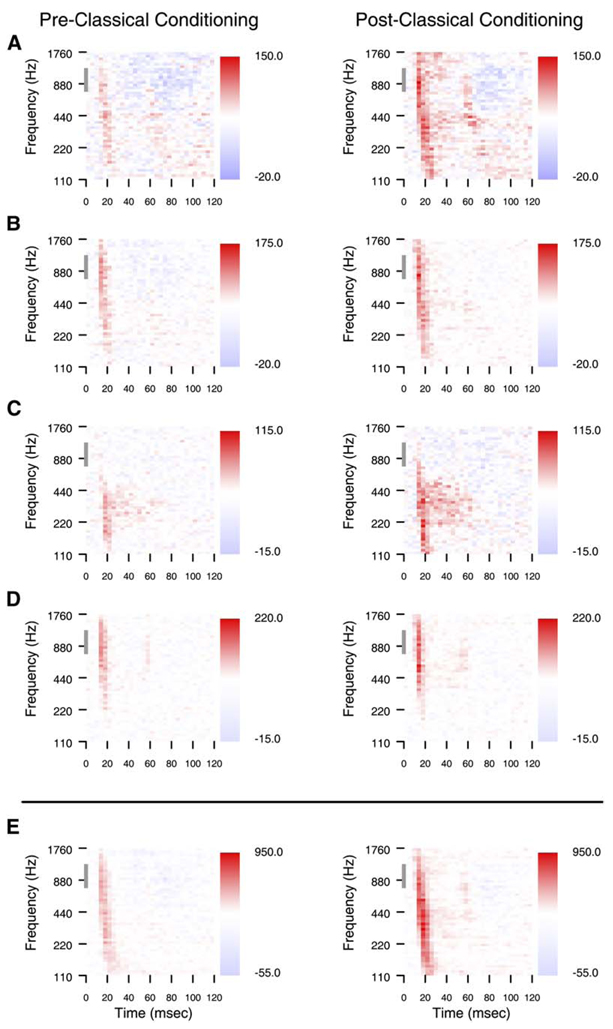
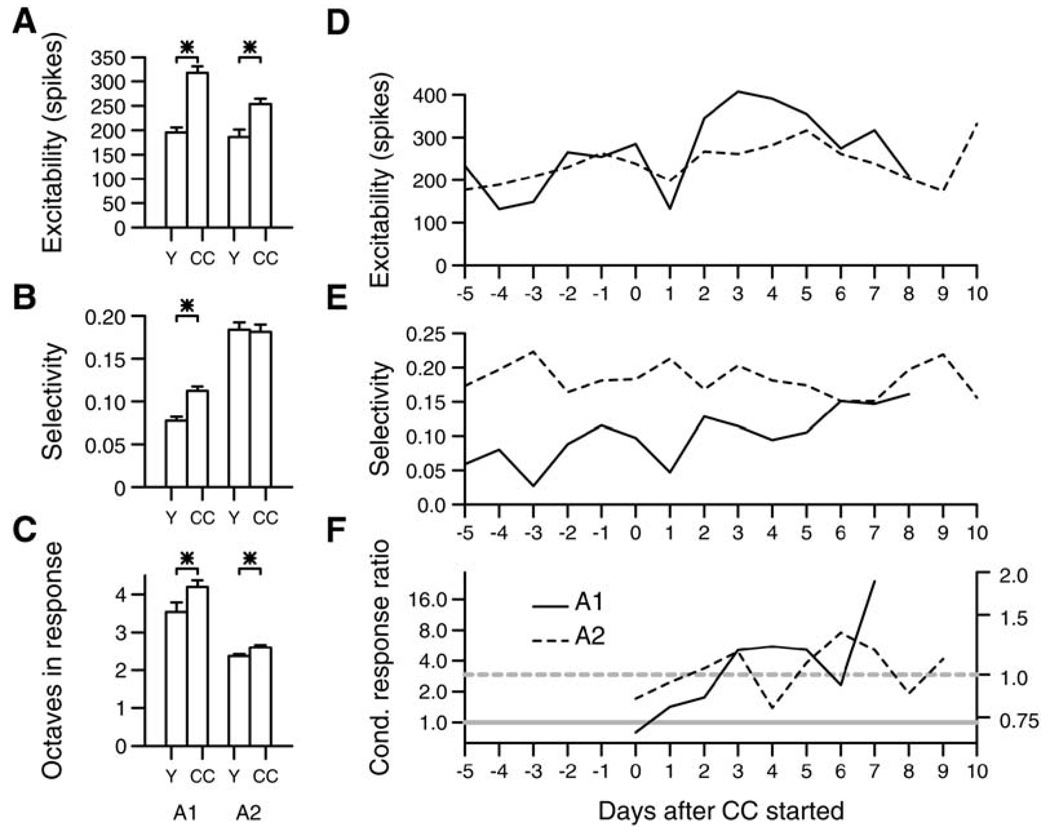
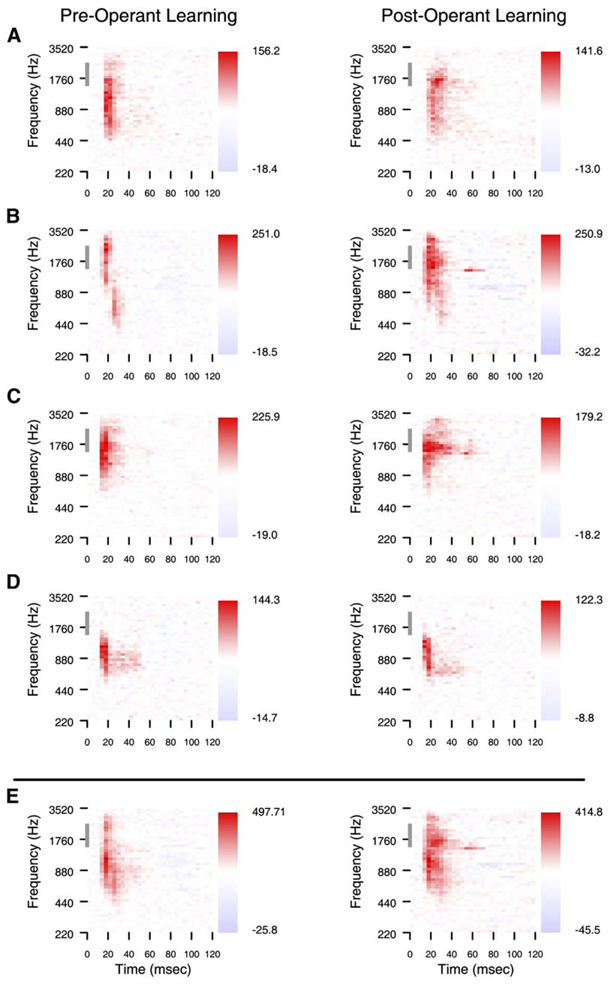
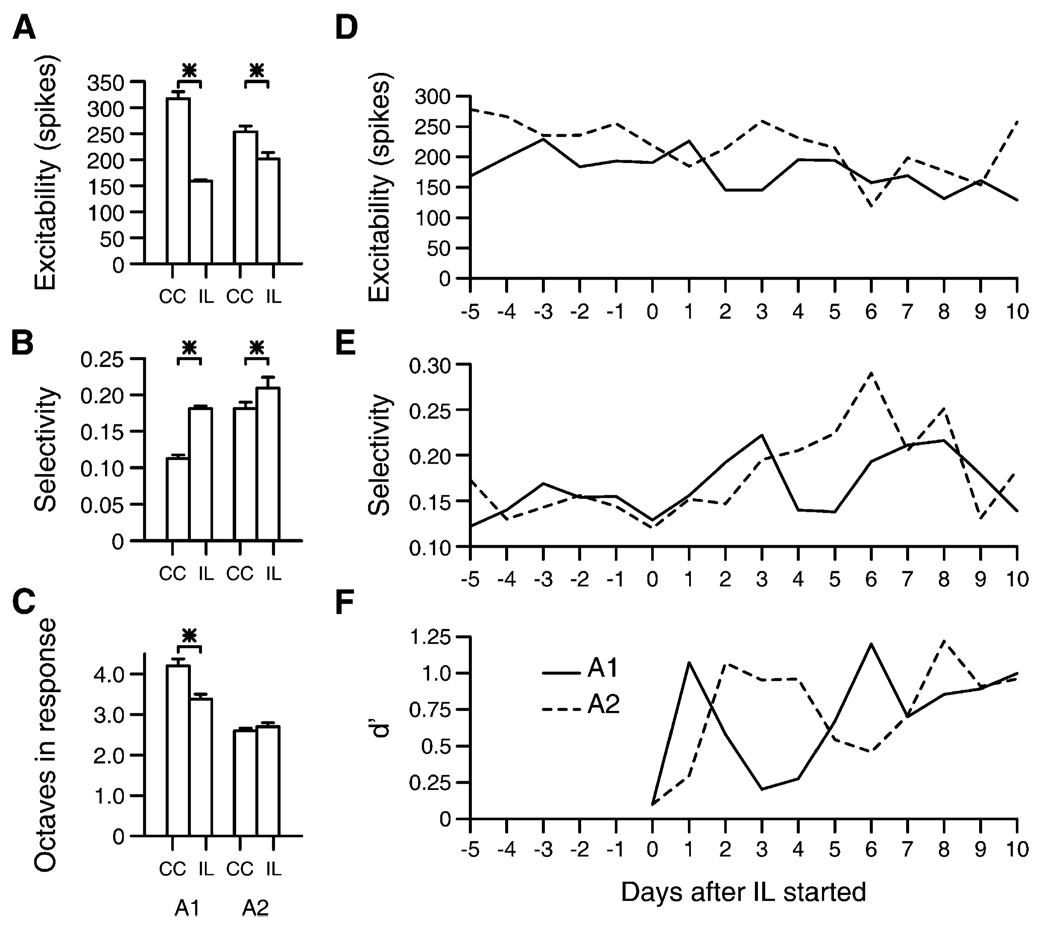
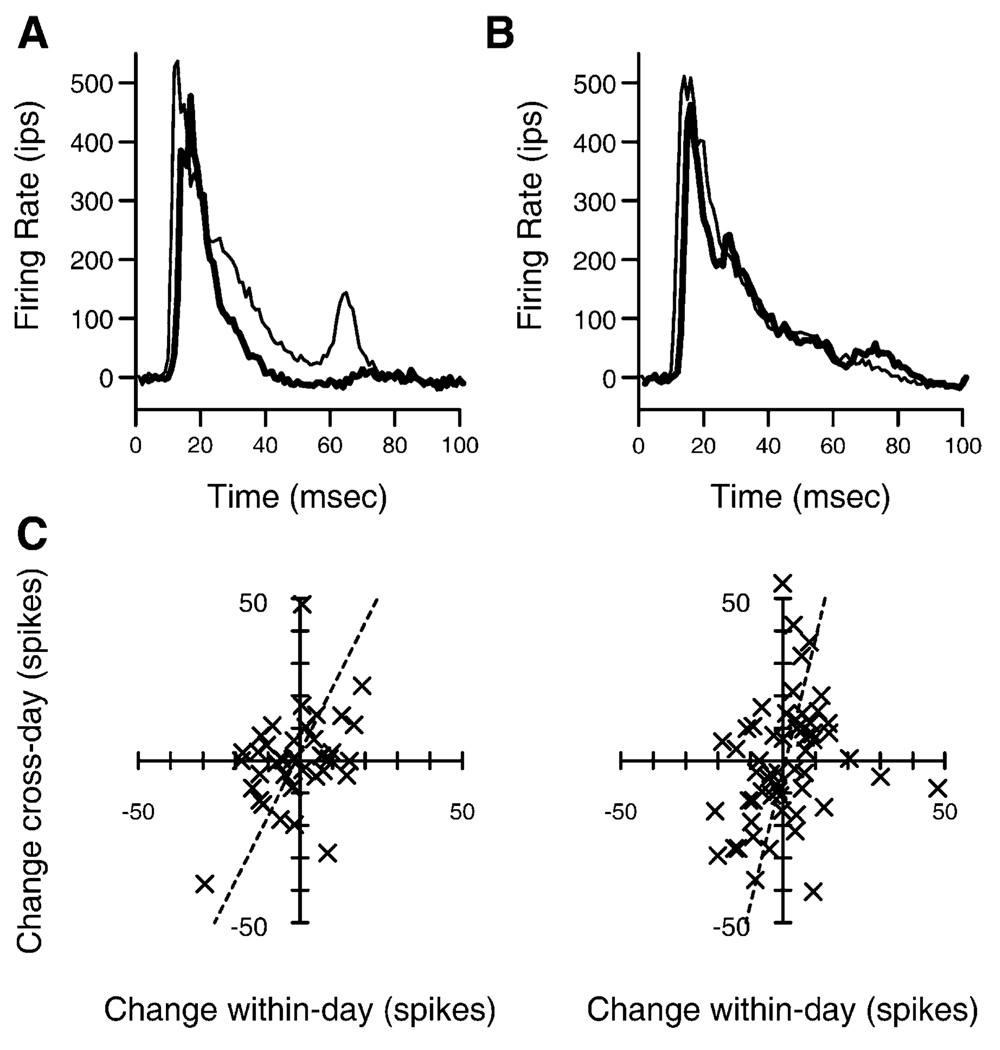
We tested the involvement of cognition in adult experience-dependent neuroplasticity using primate cortical implants. In a prior study, learning an operant sensory discrimination increased cortical excitability and target selectivity. Here, the prior task was separated into three behavioral phases. First, naive animals were exposed to stimulus-reward pairings from the prior study. These yoked animals did not have to discriminate to be rewarded and did not learn the discrimination. The plasticity observed in the prior study did not occur. Second, the animals were classically conditioned to discriminate the same stimuli in a simplified format. Learning was accompanied by increased sensory response strength and an increased range of sensory inputs eliciting responses. The third study recreated the original operant discrimination, and selectivity for task targets increased. These studies demonstrate that cognitive association between sensory stimuli and reinforcers accompanies adult experience-dependent cortical plasticity and suggest that selectivity in representation and action are linked.


Figures

Figure 1
Figure 1. Lateral View of Owl Monkey Brain Showing the Position of Right A1 Adjacent to the Lateral Sulcus
The implant spans much of the portion of A1 that is exposed on the surface. The grid of dots in the right figure shows a putative overlay of electrode positions on the A1 cortical map.
Figure 2
Figure 2. Yoked Animal Behavior
(A) Yoked behavior. The guide animal performs an operant discrimination. The yoked animal hears the same sounds and receives the same rewards, but does not play a causal role. (B) Behavioral task. The guide animal makes an orienting response, leaning its head forward to break an infrared beam, to initiate the trial. A series of standard frequency tone pips are played. After two to six consecutive standards, the tone pip frequency is increased to a target frequency. The guide animal is rewarded if it breaks its orienting response after the first target tone pip and within reaction time limits.
Figure 3
Figure 3. Yoked Behavior Physiological Plasticity
(A) Example compound receptive field from animal one during the prelearning phase of the yoked behavior. Each row plots the firing rate changes measured in response to the corresponding frequency tone pip. The vertical bar on the ordinate covers the frequency range of the target stimuli. The horizontal bar on the abscissa shows the time at which the tone pip was on. The compound receptive field shows the sum of spiking activity from all electrodes. The color bar codes firing rate changes above and below the average prestimulus rate. (B) Compound receptive field from animal one during yoked postlearning. (C) Excitability during pre- (Y1) to postlearning (Y2) in animal one (A1) and animal two (A2). (D) Target onset selectivity changes. No significant changes were found. (E) Response range. Animal two showed a significant increase (t test, p < 0.05). Error bars indicate standard error of the mean.
Figure 4
Figure 4. Matched Neural Responses before and after Classical Conditioning
(A–D) Single-site examples of change. Four pairs of single-site examples of change from animal one are shown. The tonal receptive fields on the left are taken from one day in the week before initiating the classical conditioning behavior, and the receptive fields on the right from the same four sites are taken on the day of the fourth classical conditioning session. The gray bar on the ordinate indicates the frequency range of the conditioned stimuli. The distractor frequency was 660 Hz. Each site’s pair of receptive fields is normalized to the same maximum and minimum color scale, and changes in firing rate from the mean rate are shown next to the color scales. (E) The compound receptive fields from the same two days. The compound receptive field is based on the sum of action potentials sampled from all active electrodes.
Figure 5
Figure 5. Classical Conditioning Behavior Physiological Plasticity
(A) Excitability changes. Both animals showed significant increases in excitability. (B) Target onset selectivity changes. Animal one showed an increase in the target onset selectivity. (C) Response range. Both animals showed a significant increase in the response range. (D) Daily measurements of excitability changes. Day 0 was the first day of the classical conditioning behavior. Data from animal one are shown with a solid line, and data from animal two are shown with a dashed line. (E) Daily measurements of selectivity changes. (F) Daily measurements of the conditioned response ratio, or the ratio of the licking rate after target stimuli to the rate after non-target stimuli. The left ordinate scale applies to animal one, and the right scale applies to animal two. Gray dashed and nondashed lines show the ratio expected by chance for each animal. Data are log-scaled on the ordinates. Error bars indicate standard error of the mean.
Figure 6
Figure 6. Matched Neural Responses before and after Operant Conditioning
(A–D) Single-site examples of change. Four pairs of single-site examples of change from animal two are shown. The tonal receptive fields on the left are taken from 1 day before initiating the instrumental learning behavior, and the receptive fields on the right from the same four sites are taken 2 weeks later. The gray bar on the ordinate indicates the frequency range of the conditioned stimuli. The distractor frequency was 1109 Hz. Each receptive field is independently normalized to its maximum and minimum. (E) The compound receptive field shows the sum of all single-site receptive fields from the same two recording days.
Figure 7
Figure 7. Instrumental Learning Physiological Plasticity
(A) Excitability changes. Both animals showed significant decreases in excitability from CC to IL conditions. (B) Target onset selectivity changes. Both animals showed significant increases in the target onset selectivity. (C) Response range. Animal one showed a significant decrease in the response range. (D) Daily measurements of excitability in the week before, and 2 weeks after, initiation of the instrumental learning condition. Data from animal one are shown with a solid line, and data from animal two are shown with a dashed line. (E) Daily measurements of selectivity before and after instrumental learning. (F) Daily measurements of d′, a signal detection measure indicating the discriminability shown by the behavioral choices between the task standard and targets. Error bars indicate standard error of the mean.
Figure 8
Figure 8. Temporal Plasticity and Neuronal Consolidation
(A) Population peristimulus time histogram showing the average firing rates after target tonal stimuli in the instrumental learning condition (thick line) and the classical conditioning condition (thin line). Data are from animal two. (B) Population PSTH in response to non-target frequency stimuli in the same two behavioral conditions from the same neurons. These data show only a portion of all data considered in the cortical excitability measure. (C) Correlation between within-day target onset response strength changes and across-day changes. Both animal one (left) and animal two (right) show significant positive correlations. A best-fit line is shown for each, and in each case the fit is significantly better than the null hypothesis of equality in change.

References

    1. Allard T, Clark SA, Jenkins WM, Merzenich MM. Reorganization of somatosensory area 3b representations in adult owl monkeys after digital syndactyly. J. Neurophysiol. 1991;66:1048–1058. - PubMed
    1. Aston-Jones G, Rajkowski J, Kubiak P, Alexinsky T. Locus coeruleus neurons in monkey are selectively activated by attended cues in a vigilance task. J. Neurosci. 1994;14:4467–4480. - PMC - PubMed
    1. Bakin J, Weinberger N. Induction of a physiological memory in the cerebral cortex by stimulation of the nucleus basalis. Proc. Natl. Acad. Sci. USA. 1996;93:11219–11224. - PMC - PubMed
    1. Bakin J, South D, Weinberger N. Induction of receptive field plasticity in the auditory cortex of the guinea pig during instrumental avoidance conditioning. Behav. Neurosci. 1996;110:905–913. - PubMed
    1. Bao S, Chan VT, Merzenich MM. Cortical remodelling induced by activity of ventral tegmental dopamine neurons. Nature. 2001;412:79–83. - PubMed

Publication types

LinkOut - more resources