

Anterior pituitary leptin expression changes in different reproductive states: in vitro stimulation by gonadotropin-releasing hormone
- PMID: 17046838
- PMCID: PMC1780073
- DOI: 10.1369/jhc.6A7072.2006
Anterior pituitary leptin expression changes in different reproductive states: in vitro stimulation by gonadotropin-releasing hormone
Abstract
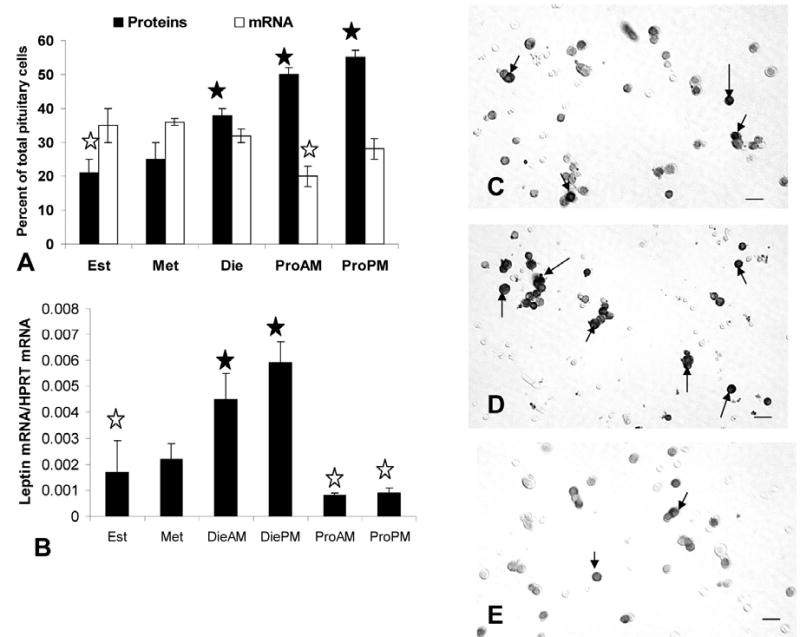
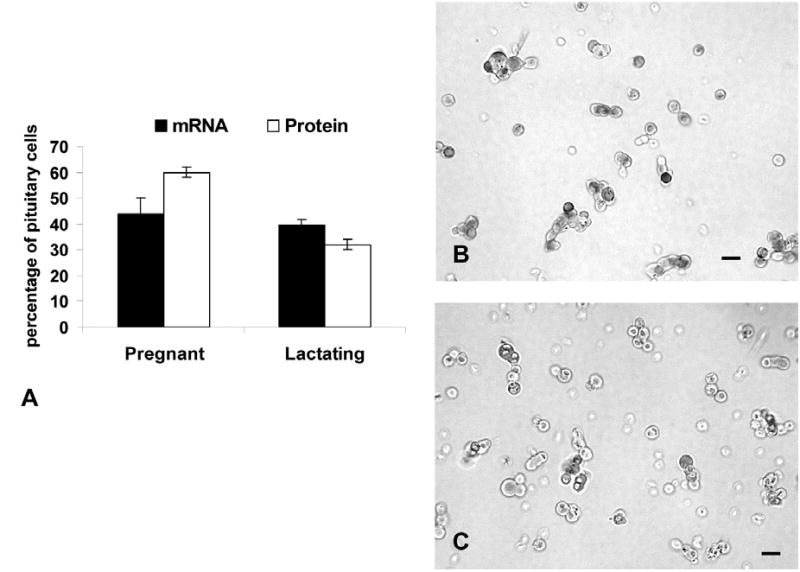
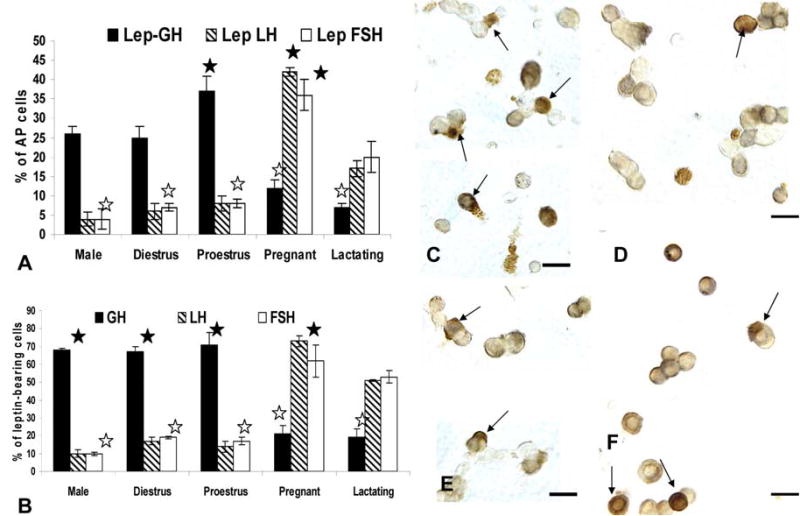
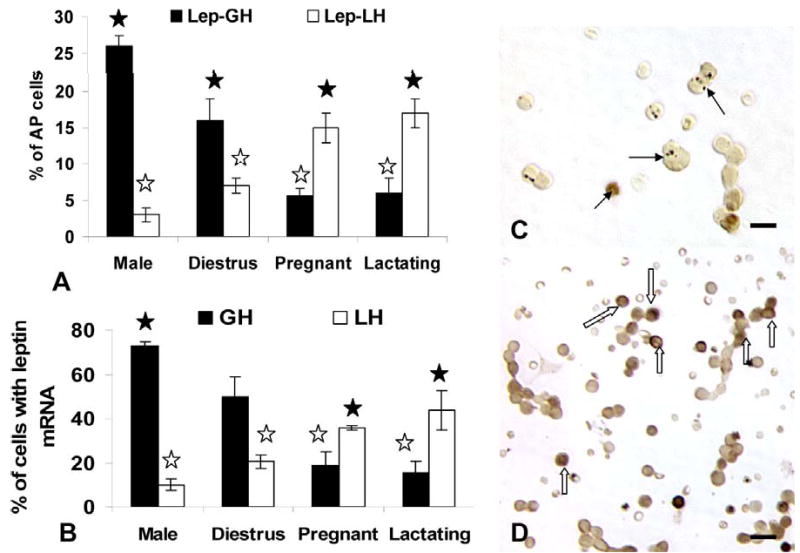
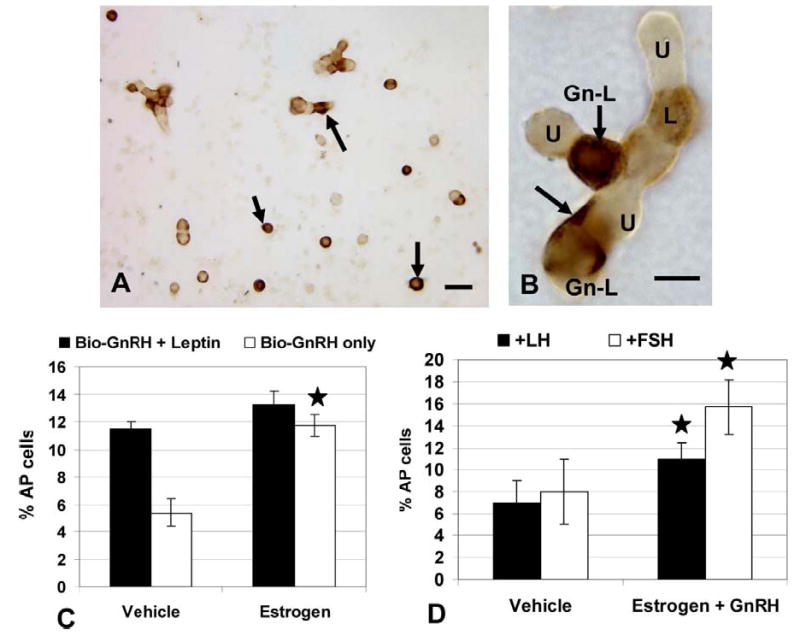
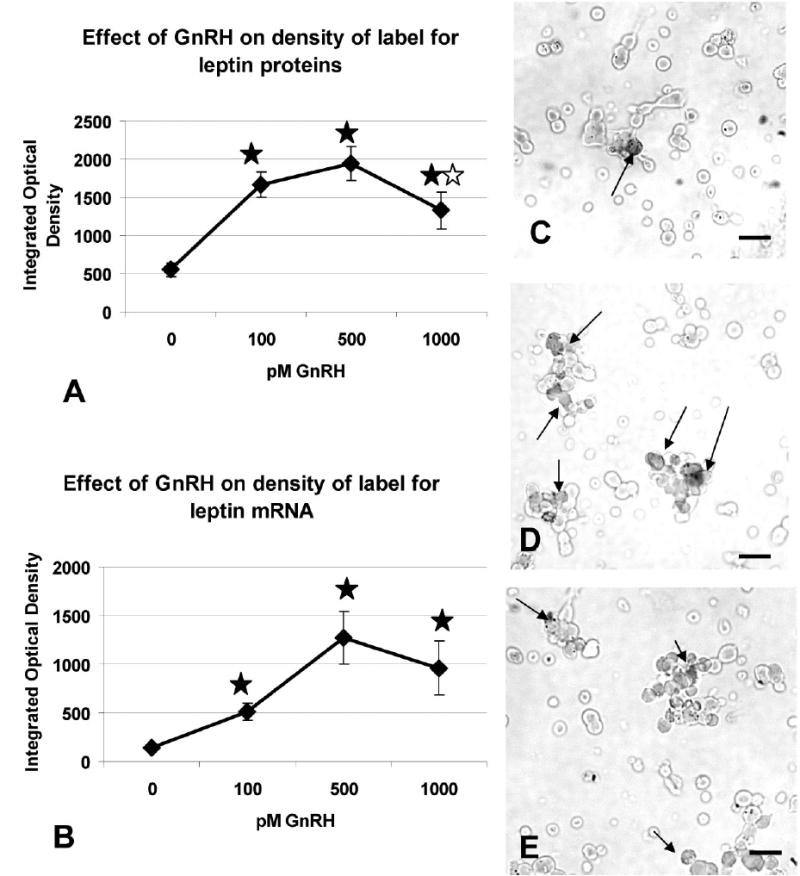
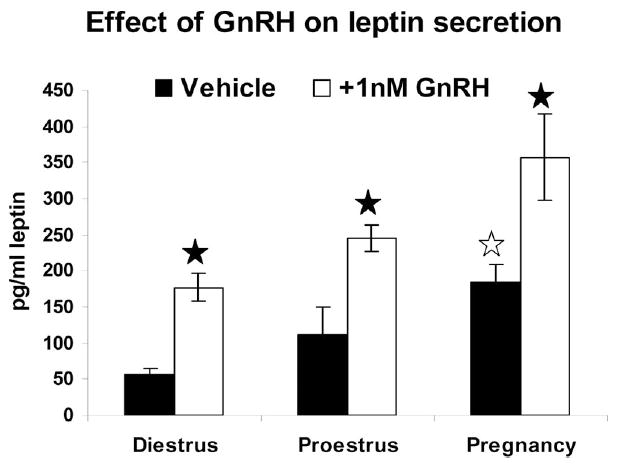
This study was designed to learn more about the changes in expression of rat anterior pituitary (AP) leptin during the estrous cycle. QRT-PCR assays of cycling rat AP leptin mRNA showed 2-fold increases from metestrus to diestrus followed by an 86% decrease on the morning of proestrus. Percentages of leptin cells increased in proestrus and pregnancy to 55-60% of AP cells. Dual labeling for leptin proteins and growth hormone (GH) or gonadotropins showed that the rise in leptin protein-bearing cells from diestrus to proestrus was mainly in GH cells. Only 10-20% of leptin cells in male or cycling female rats coexpress gonadotropins. In contrast, 50-73% of leptin cells from pregnant or lactating females coexpress gonadotropins and only 19% coexpress GH, indicating plasticity in the distribution of leptin. Leptin cells expressed GnRH receptors, and estrogen and GnRH together increased the coexpression of leptin mRNA and gonadotropins. GnRH increased cellular leptin proteins three to four times and mRNA 9.8 times in proestrous rats and stimulated leptin secretion in cultures from diestrous, proestrous, and pregnant rats. These regulatory influences, and the high expression of AP leptin during proestrus and pregnancy, suggest a supportive role for leptin during key events involved with reproduction.
Figures
Similar articles
-
Differential expression of growth hormone messenger ribonucleic acid by somatotropes and gonadotropes in male and cycling female rats.Endocrinology. 2000 Apr;141(4):1560-70. doi: 10.1210/endo.141.4.7429. Endocrinology. 2000. PMID: 10746664
-
Regulation of leptin mRNA and protein expression in pituitary somatotropes.J Histochem Cytochem. 2004 Feb;52(2):263-73. doi: 10.1177/002215540405200214. J Histochem Cytochem. 2004. PMID: 14729878
-
Cytochemical detection of gonadotropin-releasing hormone-binding sites on rat pituitary cells with luteinizing hormone, follicle-stimulating hormone, and growth hormone antigens during diestrous up-regulation.Endocrinology. 1994 Apr;134(4):1943-51. doi: 10.1210/endo.134.4.8137763. Endocrinology. 1994. PMID: 8137763
-
Long-term effects of the mammary carcinogen 7,12-dimethylbenz(a) anthracene on hypothalamic gonadotropin-releasing hormone and its pituitary receptor gene expression, during the promotion stage, in female Sprague-Dawley rats.Breast Cancer Res Treat. 2002 May;73(1):23-9. doi: 10.1023/a:1015282229388. Breast Cancer Res Treat. 2002. PMID: 12083628
-
Control of gonadotropin secretion by follicle-stimulating hormone-releasing factor, luteinizing hormone-releasing hormone, and leptin.Arch Med Res. 2001 Nov-Dec;32(6):476-85. doi: 10.1016/s0188-4409(01)00343-5. Arch Med Res. 2001. PMID: 11750723 Review.
Cited by
-
Leptin Regulation of Gonadotrope Gonadotropin-Releasing Hormone Receptors As a Metabolic Checkpoint and Gateway to Reproductive Competence.Front Endocrinol (Lausanne). 2018 Jan 5;8:367. doi: 10.3389/fendo.2017.00367. eCollection 2017. Front Endocrinol (Lausanne). 2018. PMID: 29354094 Free PMC article.
-
Adipocyte versus pituitary leptin in the regulation of pituitary hormones: somatotropes develop normally in the absence of circulating leptin.Endocrinology. 2014 Nov;155(11):4316-28. doi: 10.1210/en.2014-1172. Epub 2014 Aug 13. Endocrinology. 2014. PMID: 25116704 Free PMC article.
-
The somatotrope as a metabolic sensor: deletion of leptin receptors causes obesity.Endocrinology. 2011 Jan;152(1):69-81. doi: 10.1210/en.2010-0498. Epub 2010 Nov 17. Endocrinology. 2011. PMID: 21084451 Free PMC article.
-
Ablation of leptin signaling to somatotropes: changes in metabolic factors that cause obesity.Endocrinology. 2012 Oct;153(10):4705-15. doi: 10.1210/en.2012-1331. Epub 2012 Aug 3. Endocrinology. 2012. PMID: 22865370 Free PMC article.
-
Paracrinicity: the story of 30 years of cellular pituitary crosstalk.J Neuroendocrinol. 2008 Jan;20(1):1-70. doi: 10.1111/j.1365-2826.2007.01616.x. J Neuroendocrinol. 2008. PMID: 18081553 Free PMC article. Review.
References
-
- Barash IA, Cheung CC, Weigle DS, Ren H, Kabigting EB, Kuijper JL, Clifton DK, Steiner RA. Leptin is a metabolic signal in the reproductive system. Endocrinology. 1996;137:3144–3147. - PubMed
-
- Bédécarrats GY, Kaiser UB. Differential Regulation of Gonadotropin Subunit Gene Promoter Activity by Pulsatile Gonadotropin-Releasing Hormone (GnRH) in perifused LBT2. Cells: Role of GnRH Endocrinology. 2003;144:1802–1811. - PubMed
-
- Belchetz PE, Plant TM, Nakai Y, Keogh EJ, Knobil E. Hypophysial responses to continuous and intermittent delivery of hypothalamic gonadotropin-releasing hormone. Science. 1978;202:631–633. - PubMed
-
- Bradley RL, Cleveland KA, Cheatham B. The Adipocyte as a Secretory Organ: Mechanisms of Vesicle Transport and Secretory Pathways Recent Progress in Hormone. Research. 2001;56:329–358. - PubMed
-
- Burger LL, Dalkin AC, Aylor KW, Haisenleder DJ, Marshall JC. GnRH pulse frequency modulation of gonadotropin subunit gene transcription in normal gonadotropes-assessment by primary transcript assay provides evidence for roles of GnRH and follistatin. Endocrinology. 2002;143:3243–3249. - PubMed
Publication types
MeSH terms
Substances
Grants and funding
LinkOut - more resources
Full Text Sources
Molecular Biology Databases
