. 2007 Feb 15;109(4):1451-9.
doi: 10.1182/blood-2006-08-038901. Epub 2006 Oct 17.

Expression analysis of primary mouse megakaryocyte differentiation and its application in identifying stage-specific molecular markers and a novel transcriptional target of NF-E2

Affiliations

Expression analysis of primary mouse megakaryocyte differentiation and its application in identifying stage-specific molecular markers and a novel transcriptional target of NF-E2

Zhao Chen et al. Blood. .

Abstract

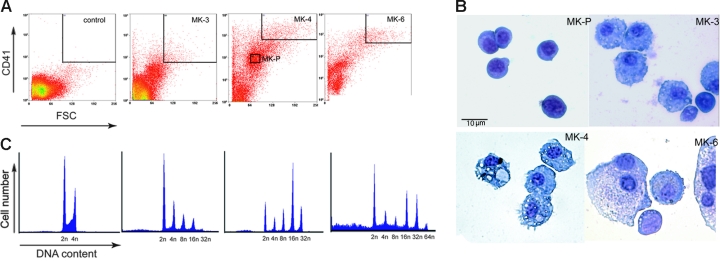
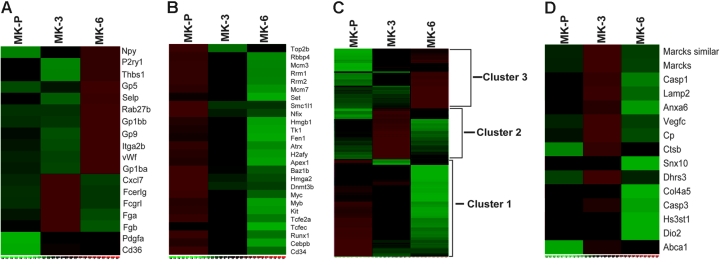
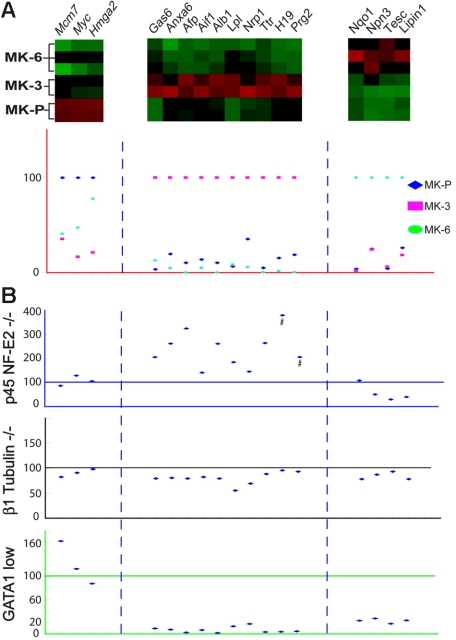
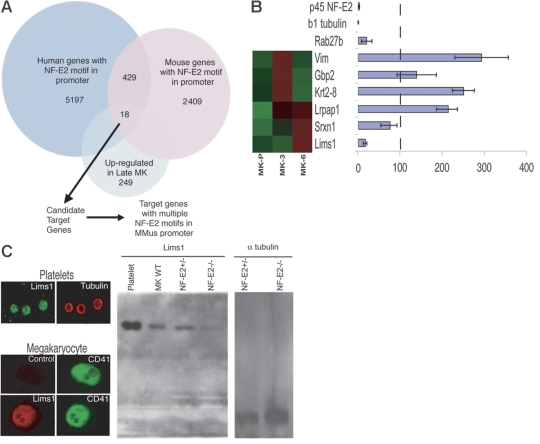
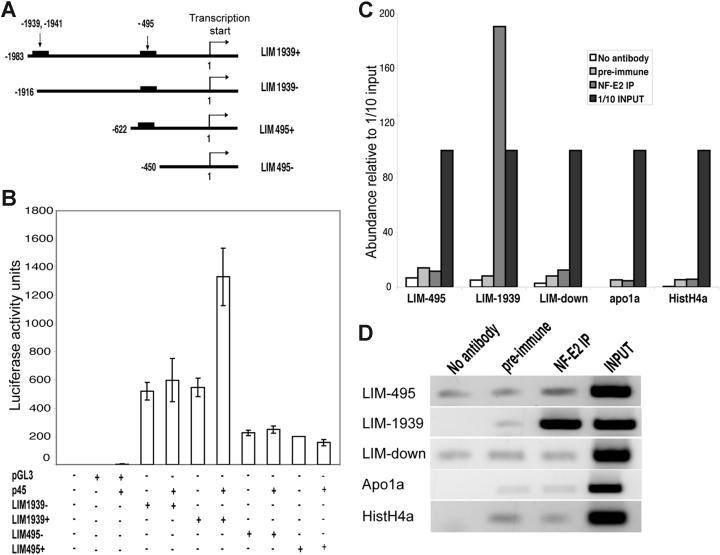
Megakaryocyte (MK) differentiation is well described in morphologic terms but its molecular counterparts and the basis for platelet release are incompletely understood. We profiled mRNA expression in populations of primary mouse MKs representing successive differentiation stages. Genes associated with DNA replication are highly expressed in young MKs, in parallel with endomitosis. Intermediate stages are characterized by disproportionate expression of genes associated with the cytoskeleton, cell migration, and G-protein signaling, whereas terminally mature MKs accumulate hemostatic factors, including many membrane proteins. We used these expression profiles to extract a reliable panel of molecular markers for MKs of early, intermediate, or advanced differentiation and establish the value of this marker panel using mouse models of defective thrombopoiesis resulting from absence of GATA1, NF-E2, or tubulin beta1. Computational analysis of the promoters of late-expressed MK genes identified new candidate targets for NF-E2, a critical transcriptional regulator of platelet release. One such gene encodes the kinase adaptor protein LIMS1/PINCH1, which is highly expressed in MKs and platelets and significantly reduced in NF-E2-deficient cells. Transactivation studies and chromatin immunoprecipitation implicate Lims1 as a direct target of NF-E2 regulation. Attribution of stage-specific genes, in combination with various applications, thus constitutes a powerful way to study MK differentiation and platelet biogenesis.


Figures

Figure 1
Figure 1
Isolation of mouse MK populations at successive stages of maturation. (A) Cells harvested on different days of fetal liver culture were labeled with CD41 antibody and sorted by flow cytometry, using gates suited to the forward-scatter (FSC; size) and CD41 expression level (fluorescence) of MKs. Parameters chosen for isolating MK-3, MK-P, MK-4, and MK6 are boxed within the corresponding plots. (B) May-Grünwald-Giemsa–stained cells representing the 4 MK populations sorted by flow cytometry. (C) Profiles of the DNA content of the sorted MK populations, labeled with propidium iodide and analyzed by flow cytometry.
Figure 2
Figure 2
Gene-expression analysis of MK differentiation. Relative mRNA expression of individual genes (rows) is shown for 3 MK populations (columns) on a scale from low (green) to high (red) levels. (A) Relative expression of known MK/platelet transcripts in the 3 populations, indicating that abundant platelet genes are highly represented in mature MKs compared with MK-P and that some markers are activated earlier than others. (B) Partial representation of transcripts that are highly expressed in MK-P and subsequently extinguished. (C) Hierarchical clustering of the 594 probe sets identified through analysis of variance (ANOVA) in MK populations, revealing clusters that correspond well with successive stages. (D) Of the 32 genes implicated in retinoic acid signaling, 15 are highly expressed in MK-3, which represents a significant overlap (highest GSEA rank in our analysis) and encompasses factors that function in diverse processes.
Figure 3
Figure 3
Molecular markers of MK differentiation stages. (A) Distinctive profiles of putative stage–selective markers revealed in microarray analysis (red = high, green = low levels) and confirmed by qRT-PCR in independent flow-sorted wild-type MK populations. To display the results, peak expression of each marker is represented at 100% in the stage with which it is best associated (although absolute levels of each may differ significantly), and transcript levels in the other 2 populations are expressed in relative terms. (B) Graphic representation of real-time qRT-PCR analysis of candidate molecular markers in unsorted (BSA gradient-purified) MKs derived from mouse models of defective MK differentiation. Individual genes are represented in the same columns throughout the figure and the levels of each are expressed in relation to those observed in wild-type (littermate) MK cultures, which is set at 100%. p45 NF-E2−/− MKs carry higher levels of genes that normally mark MK-3, with minimal change in MK-P markers and reduced levels of MK-6 genes. GATA1lo MKs show significantly reduced expression of genes that normally express well in MK-3 and MK-6, whereas changes in expression of this marker gene panel in β1 tubulin–null MKs are negligible. Error bars are omitted for ease of viewing but are included in Figure S5. #Plotted at one third of actual values to fit the scale.
Figure 4
Figure 4
Identification of candidate NF-E2 transcriptional targets. (A) Outline of the computational approach to identify targets of NF-E2 regulation among transcripts that are significantly enriched in mature MKs. Eighteen genes carried NF-E2 binding sites in their promoters and 6 of these promoters contain 2 or more NF-E2 motifs. (B) Candidate NF-E2 target genes. Microarray results of MK expression are shown on the left (high expression, red; low levels, green) and results of qRT-PCR in p45 NF-E2−/− MKs on the right. For each gene, expression in p45 NF-E2+/− MKs is set to 100% (vertical dashed line) and relative mRNA levels in NF-E2–null MKs are represented in the bar graph. Lims1 mRNA is reduced to levels comparable to those of known NF-E2–dependent genes, Rab27b and β1 tubulin. (C) LIMS1 protein is highly expressed in MKs and blood platelets and levels are reduced in the absence of NF-E2. A representative mature (CD41hi) MK is shown stained for LIMS1. Immunoblot analysis also reveals LIMS1 expression in platelets and MKs, with significantly reduced amounts in p45 NF-E2−/− MKs compared with wild-type (WT) or heterozygous cells. Lanes to the far right represent the loading control (α-tubulin) for heterozygous and nullizygous mutant MKs, respectively. Error bars in (B) represent standard deviation. Images in (C) were captured as described in “Materials and Methods.”
Figure 5
Figure 5
Lims1 is a direct transcriptional target of NF-E2. (A) Schema of reporter constructs with presence or deletion of putative NF-E2 binding sites, which are indicated in terms of their position relative to the transcription start site (+1). (B) Results of luciferase reporter assays for the Lims1 promoter region and its deletions variants. COS cells were transfected with the reporter (pGL3 or LIM series) construct in the presence or absence of p45 NF-E2 expression plasmid. (C) Quantitation of MK chromatin IP (ChIP) results for the 2 putative NF-E2 binding sites in the Lims1 promoter and controls. Immunoprecipitated DNA was amplified by qPCR and the abundance of individual fragments is normalized to that of input (pre-IP) DNA. LIM-495 and LIM-1939 amplify corresponding fragments in the Lims1 promoter and LIM-down interrogates sequences approximately 4 kb downstream; other controls test for IP of promoter fragments in the Apo1a and HistoneH4a genes. (D) Agarose gel electrophoresis of PCR fragments after ChIP. The signals for input DNA with all primer sets and for LIM-1939 after NF-E2 IP were saturated well before the 33 cycles of PCR applied in this experiment; all other signals seem to represent background. Error bars in (B) represent standard deviation.

References

    1. Ebbe S, Stohlman FJ, Overcash J, Donovan J, Howard D. Megakaryocyte size in thrombocytopenic and normal rats. Blood. 1968;32:383–392. - PubMed
    1. Odell TT, Jackson CW. Polyploidy and maturation of rat megakaryocytes. Blood. 1968;32:102–111. - PubMed
    1. Zucker-Franklin D. Megakaryocytes and platelets. In: Zucker-Franklin D, Greaves MF, Grossi CE, Marmont AM, editors. Atlas of Blood Cells: Function and Pathology. 2nd ed. Vol 1. Philadelphia, PA: Lea & Febiger; 1989. pp. 623–693.
    1. Radley JM, Haller CJ. The demarcation membrane system of the megakaryocyte: a misnomer? Blood. 1982;60:213–219. - PubMed
    1. Italiano JE, Lecine P, Shivdasani RA, Hartwig JH. Blood platelets are assembled principally at the ends of proplatelet processes produced by differentiated megakaryocytes. J Cell Biol. 1999;147:1299–1312. - PMC - PubMed

Publication types