. 2007 Feb 15;160(1):144-8.
doi: 10.1016/j.jneumeth.2006.08.018. Epub 2006 Oct 17.

Advanced imaging of multiple mRNAs in brain tissue using a custom hyperspectral imager and multivariate curve resolution

Affiliations

Advanced imaging of multiple mRNAs in brain tissue using a custom hyperspectral imager and multivariate curve resolution

Vicki L Sutherland et al. J Neurosci Methods. .

Abstract

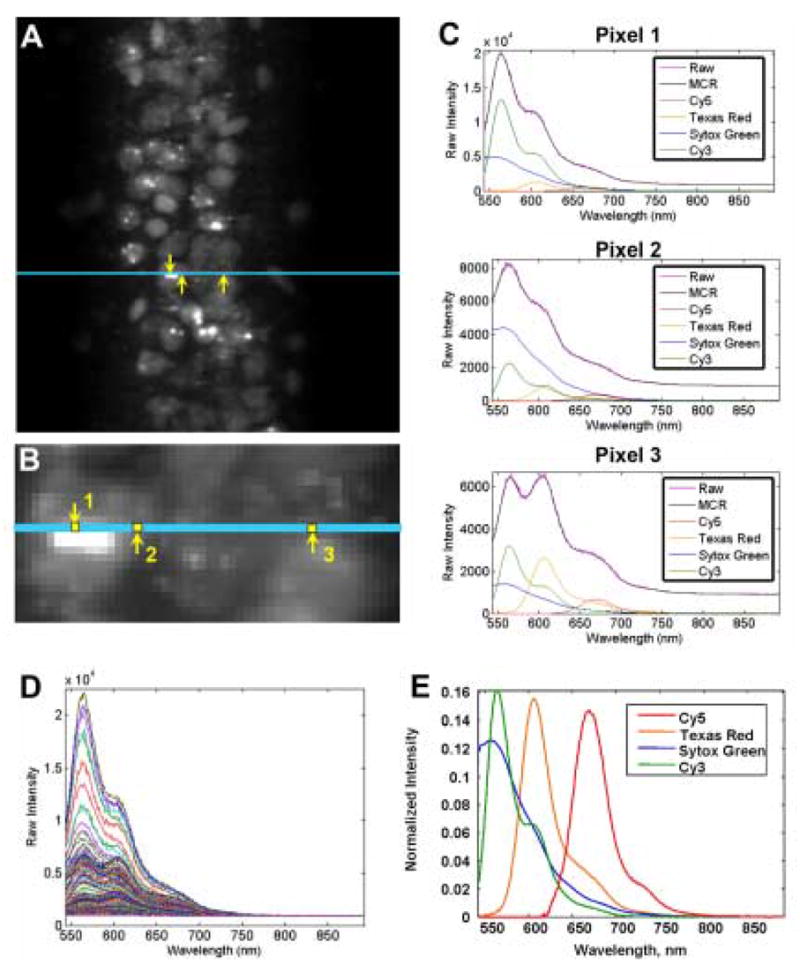
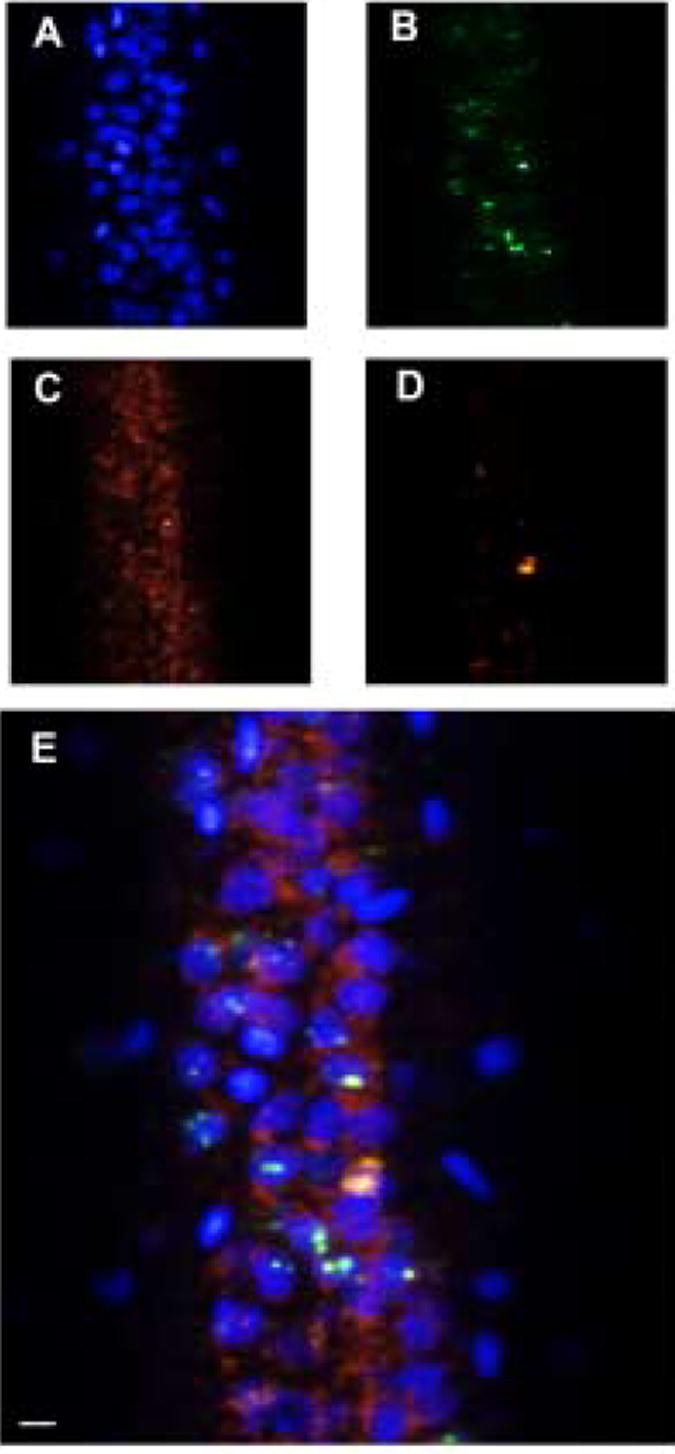
Simultaneous imaging of multiple cellular components is of tremendous importance in the study of complex biological systems, but the inability to use probes with similar emission spectra and the time consuming nature of collecting images on a confocal microscope are prohibitive. Hyperspectral imaging technology, originally developed for remote sensing applications, has been adapted to measure multiple genes in complex biological tissues. A spectral imaging microscope was used to acquire overlapping fluorescence emissions from specific mRNAs in brain tissue by scanning the samples using a single fluorescence excitation wavelength. The underlying component spectra obtained from the samples are then separated into their respective spectral signatures using multivariate analyses, enabling the simultaneous quantitative measurement of multiple genes either at regional or cellular levels.


Figures

Figure 1
Figure 1
MCR analysis applied to hyperspectral image data from the dorsal hippocampus (CA1). (A) Grayscale mean intensity image. Entire image contains ~50000 fluorescence emission spectra. Cyan line indicates one line of excitation light used to generate the image. Spectra from each of the 222 pixels on this line are acquired simultaneously in the line-imager. (B) Enlargement of the area shown in (A). Within the cyan excitation line, three pixels of differing spectral composition are called out to illustrate the analysis procedure and results. (C) Raw data and analysis results from three example pixels (Pixel 1, Pixel 2 and Pixel 3) along the line of excitation shown in (A) and (B). Pixels are indicated with yellow arrows and numbered. Each plot shows the raw fluorescence emission spectrum obtained at the pixel of corresponding number in (B), as well as the MCR modeled spectrum and the four individual, scaled component spectra as determined by the analysis for that pixel. (D) 222 overlapping fluorescence emission spectra from all pixels along the cyan line shown in (B). (E) MCR extracted component spectra corresponding to the four dyes in the tissue, Sytox green (523 nm, blue trace), Cy3 (565 nm, green trace), Texas Red (615 nm, orange trace), and Cy5 (670 nm, red trace). The extracted component spectra are normalized to unit length in this panel.
Figure 2
Figure 2
High resolution hyperspectral images of the dorsal hippocampus (CA1) labeled with 4 dyes having overlapping emission spectra: Sytox green (523 nm), Cy3 (565 nm), Cy5 (670 nm), and Texas Red (615 nm). In addition to identifying the pure component spectra shown in Fig. 1, the MCR analysis generates images that correspond to the concentrations of each of the components. (A) Sytox green labels the nuclei (blue), (B) Cy3 identifies the immediate early gene, Arc (green), (C) Cy5 labels CAMKII (red), and (D) Texas Red labels GAD65/67 (orange). (D) An RGB image constructed from the false-colored individual images. Mean intensity image of the original raw data is shown in Figure 1a. Scale bar = 10 μm.
Figure 3
Figure 3
Low resolution hyperspectral images of rat brain coronal sections labeled with 4 dyes having overlapping emission spectra: Sytox green (523 nm), Cy3 (565 nm), Cy5 (670 nm), and Texas Red (615 nm). In addition to identifying the pure component spectra shown in Fig. 1, the MCR analysis generates images that correspond to the concentrations of each of the components. (A) Sytox green labels the nuclei, (B) Cy3 identifies the immediate early gene, Arc, (C) Cy5 labels CAMKII, and (D) Texas Red labels GAD65/67. Scale bar = 1.0 mm.

References

    1. Dickinson ME, Bearman G, Tille S, Lansford R, Fraser SE. Multi-spectral imaging and linear unmixing add a whole new dimension to laser scanning fluorescence microscopy. Biotechniques. 2001;31:1272–8. - PubMed
    1. Guzowski JF, McNaughton BL, Barnes CA, Worley PF. Environment-specific expression of the immediate-early gene Arc in hippocampal neuronal ensembles. Nat. Neurosci. 1999;2:1120–4. - PubMed
    1. Guzowski JF, Setlow B, Wagner EK, McGaugh JL. Experience-dependent gene expression in the rat hippocampus after spatial learning: a comparison of the immediate-early genes Arc, c-fos, and zif268. J. Neurosci. 2001;21:5089–98. - PMC - PubMed
    1. Haaland DM, Timlin JA, Sinclair MB, Van Benthem MH, Martinex MJ, Aragon AD, Werner-Washburne M. Multivariate curve resolution for hyperspectral image anlaysis: applications to microarray technology. Proc SPIE. 2003;4959:55–66.
    1. Huebschman ML, Schultz RA, Garner HR. Characteristics and capabilities of the hyperspectral imaging microscope. IEEE Eng. Med. Biol. Mag. 2002;21:104–17. - PubMed

Publication types

LinkOut - more resources