. 2007 Mar 15;160(2):187-96.
doi: 10.1016/j.jneumeth.2006.09.007. Epub 2006 Oct 16.

A mouse model of sensorimotor controlled cortical impact: characterization using longitudinal magnetic resonance imaging, behavioral assessments and histology

Affiliations

A mouse model of sensorimotor controlled cortical impact: characterization using longitudinal magnetic resonance imaging, behavioral assessments and histology

Gregory Onyszchuk et al. J Neurosci Methods. .

Abstract

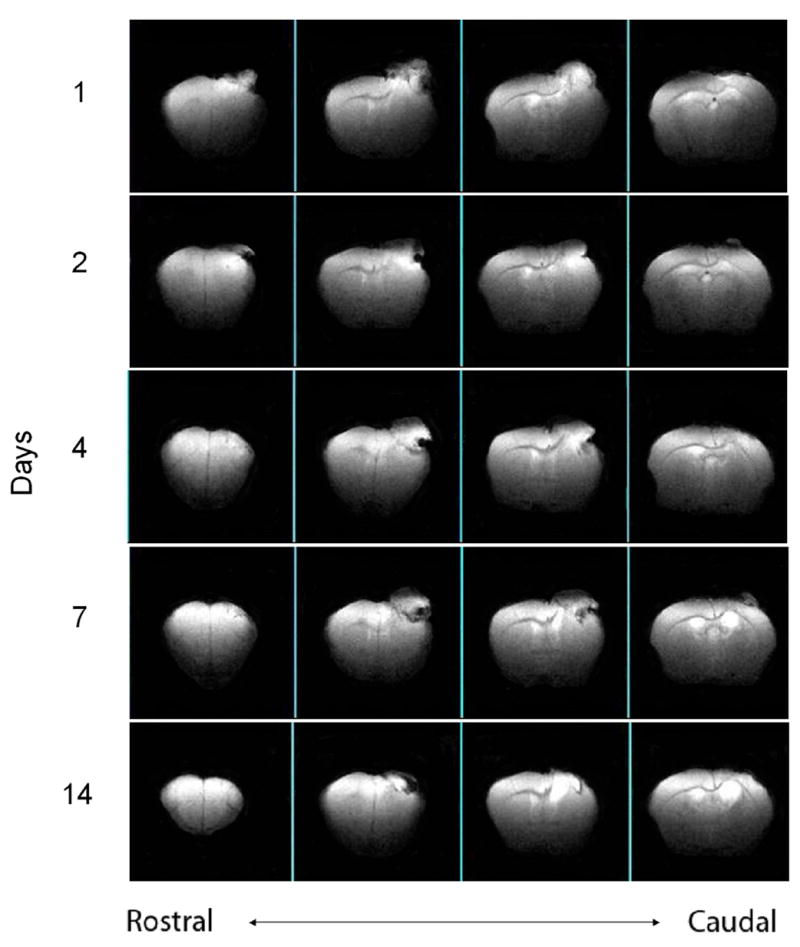
The present study establishes a new mouse model for traumatic brain injury (TBI), using an electromechanically driven linear motor impactor device to deliver a lateral controlled cortical impact (CCI) injury to the sensorimotor cortex. Lesion cavity size was measured, and inter-animal consistency demonstrated, at 14 days post injury. Qualitative information regarding damage progression over time was obtained by scanning with high field magnetic resonance imaging (MRI) at five time points following injury. Functional impairment and recovery were measured with the Rotarod, gridwalk and cylinder tests, and lesion cavity volume was measured post mortem with thionin-stained tissue sections. The study establishes the reliability of a linear-motor based device for producing repeatable damage in a CCI model, demonstrates the power of longitudinal MRI in studying damage evolution, and confirms that a simple battery of functional tests record sensorimotor impairment and recovery.


Figures

Figure 1
Figure 1
Drawing of the mouse CCI injury apparatus showing the impactor and part of its mounting system, the craniotomy location, and the orientation of the impactor tip to ensure perpendicularity to the exposed dura and to the surface of the brain.
Figure 2
Figure 2
T2-weighted MR images of an injured animal, in the anatomically coronal (top), sagittal (middle) and horizontal (bottom) planes, scanned 14 days after injury. At this time point, the strong signal hyperintensity indicates that a lesion cavity has formed. Arrows denote the cavity. Contiguous slices, TR=2500ms, TE=45ms. Images segmented to show brain only.
Figure 3
Figure 3
Series of T2-weighted MR images the same injured animal, scanned in the anatomically coronal plane, at 1, 2, 4, 7 and 14 days after injury. Contiguous 1mm slices, TR=2500ms, TE=45ms, field of view: 16mm x10mm. Images segmented to show brain only. This time course shows an early signal hyperintensity, corresponding to acute edema, and a later hyperintensity, consistent with the development of a lesion cavity. At 14 days, there is a well-defined border between the cavity and the adjacent normal-appearing tissue.
Figure 4
Figure 4
Injury location data obtained from T2-weighted anatomically horizontal images, indicating reliable placement of injury and repeatable technique for MRI-based location verification. Squares indicate individual measurements from eight animals, cross indicates mean location.
Figure 5
Figure 5
Rotarod latency impairment and recovery data, eight animals with injury compared to eight sham animals, showing that for the injured animals, the greatest deficit was at 24 and 48 hours, with recovery to 88% of pre-injury value by 14 days. Significant differences between injury and sham scores were seen at 24, 48 and 72 hours post injury. ***:p<0.001.
Figure 6
Figure 6
Gridwalk impairment and recovery data, presented as left forelimb minus right forelimb footfaults per minutes of walking, showing a peak value in the injured animals of 6.3 at 72 hours, with modest recovery to 3.0 at 14 days., Significant differences between injury and sham scores were seen at all post injury time points. ***:p<0.001.
Figure 7
Figure 7
Spontaneous forelimb (cylinder) task impairment and recovery data, showing peak forelimb laterality score at 7 days, with reduction to 66% of peak at 14 days. Significant differences between injured and sham scores were seen at 7 days post injury *:p<0.05.
Figure 8
Figure 8
Examples of thionin-stained coronal sections near the injury epicenter. These sections are examples from three different injured animals, at the following AP coordinates with respect to bregma (top to bottom): +0.5, −0.2, −0.5. Scale bars: 1mm.
Figure 9
Figure 9
Correlation of lesion cavity volume measurements taken from thionin-stained coronal tissue sections with measurements taken from T2-weighted MR images at 14 days.

References

    1. Baskin YK, Dietrich WD, Green EJ. Two effective behavioral tasks for evaluating sensorimotor dysfunction following traumatic brain injury in mice. J Neurosci Methods. 2003;129:87–93. - PubMed
    1. Bilgen M. Simple, low-cost multipurpose RF coil for MR microscopy at 9.4 T. Magn Reson Med. 2004;52:937–940. - PubMed
    1. Bilgen M. A new device for experimental modeling of central nervous system injuries. Neurorehabil Neural Repair. 2005;19:219–226. - PubMed
    1. Cernak I. Animal models of head trauma. NeuroRx. 2005;2:410–422. - PMC - PubMed
    1. Dash PK, Moore AN, Moody MR, Treadwell R, Felix JL, Clifton GL. Post-trauma administration of caffeine plus ethanol reduces contusion volume and improves working memory in rats. J Neurotrauma. 2004;21:1573–1583. - PubMed

Publication types

MeSH terms