. 2006 Nov 1;20(21):2996-3009.
doi: 10.1101/gad.1483906. Epub 2006 Oct 18.

Defects in energy homeostasis in Leigh syndrome French Canadian variant through PGC-1alpha/LRP130 complex

Affiliations

Defects in energy homeostasis in Leigh syndrome French Canadian variant through PGC-1alpha/LRP130 complex

Marcus P Cooper et al. Genes Dev. .

Abstract

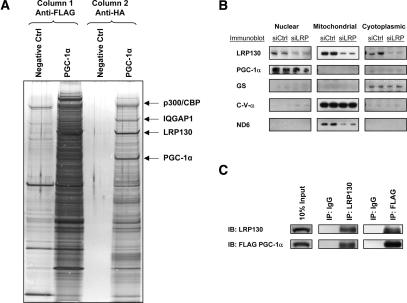
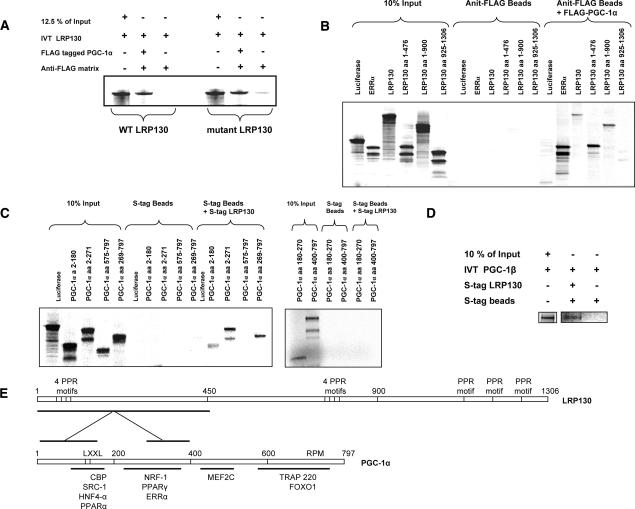
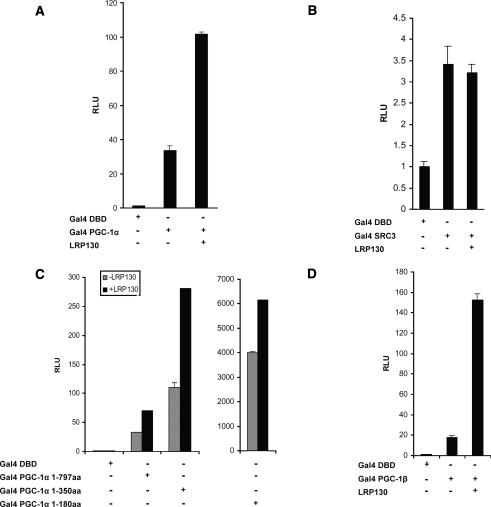
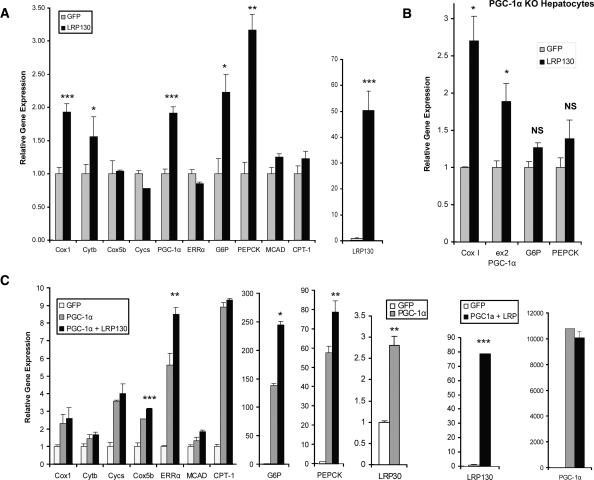
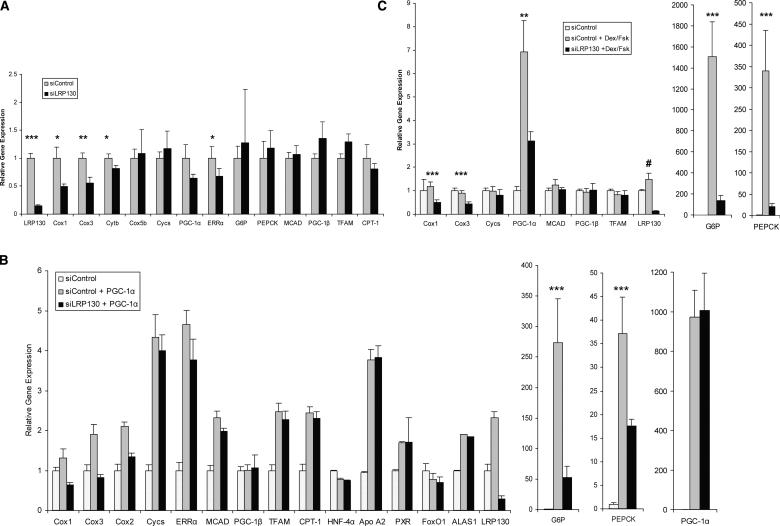
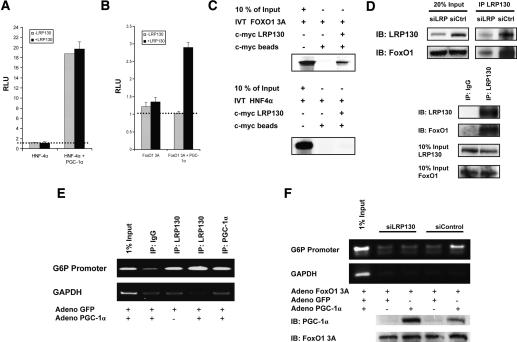
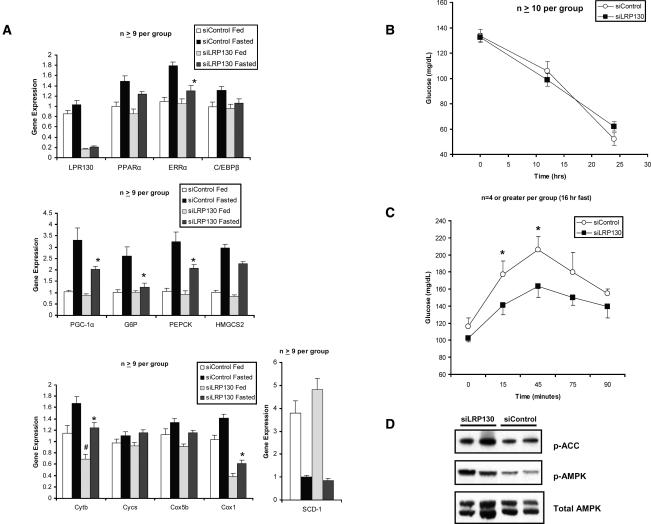
Leigh syndrome French Canadian variant (LSFC) is an autosomal recessive neurodegenerative disorder due to mutation in the LRP130 (leucine-rich protein 130 kDa) gene. Unlike classic Leigh syndrome, the French Canadian variant spares the heart, skeletal muscle, and kidneys, but severely affects the liver. The precise role of LRP130 in cytochrome c oxidase deficiency and hepatic lactic acidosis that accompanies this disorder is unknown. We show here that LRP130 is a component of the PGC-1alpha (peroxisome proliferator-activated receptor coactivator 1-alpha) transcriptional coactivator holocomplex and regulates expression of PEPCK (phosphoenolpyruvate carboxykinase), G6P (glucose-6-phosphatase), and certain mitochondrial genes through PGC-1alpha. Reduction of LRP130 in fasted mice via adenoviral RNA interference (RNAi) vector blocks the induction of PEPCK and G6P, and blunts hepatic glucose output. LRP130 is also necessary for PGC-1alpha-dependent transcription of several mitochondrial genes in vivo. These data link LRP130 and PGC-1alpha to defective hepatic energy homeostasis in LSFC, and reveal a novel regulatory mechanism of glucose homeostasis.


Figures

Figure 1.
Figure 1.
Purification of PGC-1α-specific protein complexes, and coimmunoprecipition in the nucleus. HeLa nuclear extract was incubated with purified PGC-1α protein in high salt. Following gradual dialysis and clarification, the complexes underwent sequential chromatography and native elution over Flag and HA affinity columns, respectively. (A) Silver staining showing aliquots of eluted complexes for negative control (no addition of purified protein) and PGC-1α samples following Flag chromatography (left two lanes) and HA chromatography (right two lanes). The arrows designate the positions of p300/CBP, LRP130, and PGC-1α.(B) Subcellular fractionation in H2.35 cells showing colocalization of LRP130 and PGC-1α to the nucleoplasmic fraction. Glycogen synthase (GS) is a cytoplasmic marker. C-V-α is a mitochondrial protein encoded in the nucleus. ND6 is a mitochondrial protein encoded in the mitochondrion. (C) Coimmunoprecipitation demonstrating interaction between LRP130 and PGC-1α in nucleus.
Figure 2.
Figure 2.
Physical interaction between LRP130 and PGC-1α. (A) Wild-type and mutant LRP130 were 35S-labeled by in vitro translation and incubated with purified Flag-tagged PGC-1α. (B) Truncations of LRP130 were 35S-labeled by in vitro translation and incubated with purified Flag-tagged PGC-1α. Anti-Flag matrix was used to immunopurify Flag-tagged PGC-1α protein bound to LRP130. (C) Truncations of PGC-1α or full-length PGC-1β were 35S-labeled and incubated with full-length LRP130. (D) PGC-1β was 35S-labeled and incubated with full-length LRP130. (E) Schematic of LRP130 and PGC-1α indicating regions of interaction.
Figure 3.
Figure 3.
Transcription assays using either Gal4-PGC-1α or Gal4-PGC-1β with LRP130. The indicated constructs were transiently transfected into COS cells and analyzed for luciferase activity after 24 h. (A) LRP130 cotransfected with Gal4 PGC-1α. (B) LRP130 cotransfected with SRC3. (C) LRP130 cotransfected with Gal4-PGC-1α fragments 1–180 amino acids, 1–350 amino acids, and 1–797 amino acids. (D) LRP130 cotransfected with PGC-1β. Experiments were normalized to the Gal4 DNA-binding domain (Gal4-DBD). Each experiment was performed in duplicate and is representative of n ≥ 3 independent biological experiments. Error bars represent SEM.
Figure 4.
Figure 4.
Gene expression induced by LRP130 in primary hepatocytes. Transcription of genes responsive to PGC-1α coactivation and implicated in gluconeogenesis, mitochondrial respiration, and fatty acid oxidation were measured using RT quantitative PCR. (A) Forced expression of LRP130 in primary hepatocytes. Statistical comparisons are made between GFP and LRP130. (B) Effect of forced expression of LRP130 in primary knockout (KO) hepatocytes. Residual PGC-1α transcript was detected in the knockout animals using primers for exon 2 (ex2). (C) Coforced expression of LRP130 and PGC-1α in primary hepatocytes. Statistical comparisons are made between GFP coexpressed with PGC-1α and LRP130 coexpressed with PGC-1α. Experiments were performed in triplicate and are representative of n = 3 independent biological experiments. (*) p < 0.05; (**) p < 0.01; (***) p < 0.001. Error bars represent standard deviation.
Figure 5.
Figure 5.
Effect of depletion of LRP130 on endogenous gene expression. Primary hepatocytes were depleted of endogenous LRP130 using an RNAi construct designated siLRP130 or a scrambled control, siControl. Transcription of genes responsive to PGC-1α coactivation and implicated in gluconeogenesis, heme metabolism, mitochondrial respiration, and fatty acid oxidation was measured using RT quantitative PCR. (A) Forced expression of siControl or siLRP130. (B) Coforced expression of either siControl/GFP (siControl), siControl + PGC-1α, or siLRP130 + PGC-1α. (C) Forced expression of siControl or siLRP130 in the presence or absence of dexamethasone and forskolin (Dex/Fsk). Experiments were performed in triplicate and are respresentative of n = 3 independent biological experiments. (*) p < 0.05; (**) p < 0.01; (***) p < 0.001. Asterisks designate statistical comparisons made between siControl and siLRP130 (A) siControl + PGC-1α and siLRP130 + PGC-1α (B), and siControl + Dex/Fsk and siLRP130 + Dex/Fsk (C). (#) p < 0.01; stastistical comparisons are made between siControl and siControl + PGC-1α (B), and siControl and siControl + Dex/Fsk (C). The control for Dex/Fsk contained an appropriate vehicle. Error bars represent standard deviation.
Figure 6.
Figure 6.
Effect of LRP130 on coactivation and docking of PGC-1α. H2.35 cells stably depleted of LRP130 were used for the coactivation studies. Exogenous LRP130 was used to restore LRP130 where indicated. (A) LRP130 was cotransfected with PGC-1α and HNF-4α as indicated, and a multimerized AF-1-binding element reporter construct was used. (B) LRP130 was cotransfected with PGC-1α and FoxO1 3A (constitutively active mutant) as indicated. A multimerized IRS-1-binding element reporter construct was used. The dotted line represents reporter construct alone. No statistical difference was observed between reporter alone versus reporter plus transcription factor, or for LRP130 and PGC-1α plus reporter. (C) Assessment of interactions between LRP130 and FoxO1 or HNF4α. FoxO1 or HNF4α was 35S-labeled and incubated with purified full-length S-tagged LRP130 protein. (D) Specific interaction of LRP130 with FoxO1 in liver and cells. (Top panel) Coimmunoprecipitation of LRP130 and FoxO1 from liver whole-cell extract showing dose effect of interaction. (Bottom panel) Coimmunoprecipitation from nuclear extract using H2.35 cells. (E) ChIP showing recruitment of LRP130 to the FoxO1-binding site in PGC-1α knockout (KO) primary hepatocytes. (Top panel) Radioactive ChIP processed by PhosphorImager. (F) ChIP in H2.35 cells stably depleted of LRP130 using an RNAi construct compared with a siControl cell line. The panels below indicate protein levels of PGC-1α and FoxO1 3A. Note, the upper specific band migrates in close proximity to the lower single-peak unreacted primer. Experiments were performed in n ≥ 3 independent biological experiments.
Figure 7.
Figure 7.
Effect of depletion of LRP130 in the hepatic fasting response in vivo. (A) Relative gene expression of several genes involved in energy homeostasis. Asterisks (*) indicate that statistical comparisons are made between siControl and siLRP130 in fasted animals. Number signs (#) indicate that statistical comparisons are made between siControl and siLRP130 in fed animals. (*) p < 0.05; (**) p < 0.01; (***) p < 0.001; (#) p < 0.05. Error bars represent standard deviation. (B) Comparison of glucose levels at 0, 12, and 24 h. (C) Comparison of hepatic glucose output as assessed by pyruvate tolerance test following a 16-h fast. (D) Immunoblot for AMPK, phosphorylated-AMPK (p-AMPK), and phosphorylated-acetyl CoA carboxylase (p-ACC) from the fasted animals analyzed in A. Two representative animals are shown.

References

    1. Brunet, A., Bonni, A., Zigmond, M.J., Lin, M.Z., Juo, P., Hu, L.S., Anderson, M.J., Arden, K.C., Blenis, J., Greenberg, M.E. Akt promotes cell survival by phosphorylating and inhibiting a Forkhead transcription factor. Cell. 1999;96:857–868. - PubMed
    1. Erdjument-Bromage, H., Lui, M., Lacomis, L., Grewal, A., Annan, R.S., McNulty, D.E., Carr, S.A., Tempst, P. Examination of micro-tip reversed-phase liquid chromatographic extraction of peptide pools for mass spectrometric analysis. J. Chromatogr. A. 1998;826:167–181. - PubMed
    1. Hall, R.K., Yamasaki, T., Kucera, T., Waltner-Law, M., O'Brien, R., Granner, D.K. Regulation of phosphoenolpyruvate carboxykinase and insulin-like growth factor-binding protein-1 gene expression by insulin. The role of winged helix/forkhead proteins. J. Biol. Chem. 2000;275:30169–30175. - PubMed
    1. Herzig, S., Long, F., Jhala, U.S., Hedrick, S., Quinn, R., Bauer, A., Rudolph, D., Schutz, G., Yoon, C., Puigserver, P., et al. CREB regulates hepatic gluconeogenesis through the coactivator PGC-1. Nature. 2001;413:179–183. - PubMed
    1. Hou, J., Wang, F., McKeehan, W.L. Molecular cloning and expression of the gene for a major leucine-rich protein from human hepatoblastoma cells (HepG2) In Vitro Cell. Dev. Biol. Anim. 1994;30A:111–114. - PubMed

Publication types

MeSH terms