Comparative Study
. 2006 Oct 19:7:267.
doi: 10.1186/1471-2164-7-267.

Microarray expression analysis of meiosis and microsporogenesis in hexaploid bread wheat

Affiliations
Comparative Study

Microarray expression analysis of meiosis and microsporogenesis in hexaploid bread wheat

Wayne Crismani et al. BMC Genomics. .

Abstract

Background: Our understanding of the mechanisms that govern the cellular process of meiosis is limited in higher plants with polyploid genomes. Bread wheat is an allohexaploid that behaves as a diploid during meiosis. Chromosome pairing is restricted to homologous chromosomes despite the presence of homoeologues in the nucleus. The importance of wheat as a crop and the extensive use of wild wheat relatives in breeding programs has prompted many years of cytogenetic and genetic research to develop an understanding of the control of chromosome pairing and recombination. The rapid advance of biochemical and molecular information on meiosis in model organisms such as yeast provides new opportunities to investigate the molecular basis of chromosome pairing control in wheat. However, building the link between the model and wheat requires points of data contact.

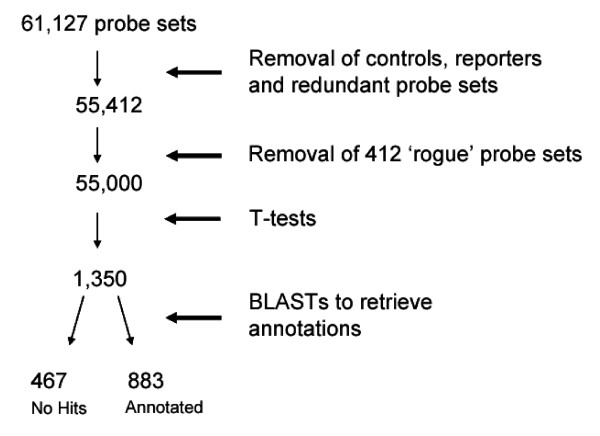
Results: We report here a large-scale transcriptomics study using the Affymetrix wheat GeneChip(R) aimed at providing this link between wheat and model systems and at identifying early meiotic genes. Analysis of the microarray data identified 1,350 transcripts temporally-regulated during the early stages of meiosis. Expression profiles with annotated transcript functions including chromatin condensation, synaptonemal complex formation, recombination and fertility were identified. From the 1,350 transcripts, 30 displayed at least an eight-fold expression change between and including pre-meiosis and telophase II, with more than 50% of these having no similarities to known sequences in NCBI and TIGR databases.

Conclusion: This resource is now available to support research into the molecular basis of pairing and recombination control in the complex polyploid, wheat.


Figures

Figure 1
Figure 1
Scatter plot and statistical analysis comparing all seven stages investigated with the wheat Affymetrix GeneChip® to one another. PM = pre-meiosis; LP = leptotene to pachytene; DA = diplotene to anaphase I; TT = telophase I to telophase II; T = tetrads; IP = immature pollen; MAN = mature anthers. All values in the figure represent the number of transcripts with corrected p-values ≤ 0.05 from t-tests performed between the two tissues of interest. The orange shading represents the pooled stages from where the 1,350 non-redundant meiotically-regulated transcripts were identified.
Figure 2
Figure 2
Filtration process used for Affymetrix wheat GeneChip® data. The controls and 'rogue' probe sets were removed from the data prior to filtration. Meiotically-regulated transcripts were then identified using t-tests, with NCBI database annotations retrieved for the remaining transcripts where available (E-value < e-10).
Figure 3
Figure 3
Transcripts with at least an eight-fold change in expression level between and including pre-meiosis to telophase II. Black = TaAffx.9800.1.S1_at; red = TaAffx.60258.2.S1_s_at; light green = Ta.10020.1.S1_at; blue = Ta.6922.1.S1_at; pink = TaAffx.38162.1.S1_at; dark green = Ta.16669.1.S1_x_at; and grey = Ta.6831.1.S1_at. PM, LP, DA and TT are as described in Figure 1.
Figure 4
Figure 4
Functional classifications and expression analysis from the developing wheat anther. Transcripts were pooled into categories based upon their annotations and having satisfied the following criteria: an E-value < e-30, a sequence length > 250 bp and their cross-hybridizing status (based on the Affymetrix designation). The data for each functional category is represented as log base 2, RMA normalized values that were centered on the average of the pre-meiosis (PM) value. Representations (n) assigned to each functional category are indicated in brackets.
Figure 5
Figure 5
Hierarchical clustering of 1,350 meiotically-regulated transcripts. The expression profiles of 1,350 transcripts (rows) were grouped across seven staged anthers (columns); pre-meiosis (PM), leptotene to pachytene (LP), diplotene to anaphase I (DA), telophase I to telophase II (TT), tetrads (T), immature pollen (IP) and mature anthers (MAN) (averages shown). Clusters of interest (described in text) are highlighted in blue and labelled I and II (pollen clusters); III, IV and V (meiotic clusters). The Y-axis for cluster groups III, IV and V is centered, log base 2, RMA normalized values.
Figure 6
Figure 6
Functional classifications for the 60 meiosis and/or cell division transcripts identified from Table 1. These transcripts were classified into functional categories based on the annotation obtained. The histogram represents the absolute values for each category, while the expression profiles for each of the candidates within each of the categories has also been shown. The red dotted line in the expression profile graphs represents the overall trend line for that category.
Figure 7
Figure 7
Three novel candidates with significant expression variability across the seven stages investigated. TaAffx.38162.1.S1_at (blue), TaAffx.9800.1.S1_at (black) and TaAffx.60258.2.S1_s_at (red) are highlighted. TaAffx.38162.1.S1_at shows more than a 64-fold increase in expression from LP to T, while TaAffx.9800.1.S1_at drops approximately 64-fold from PM to T. TaAffx.60258.2.S1_s_at is also down-regulated from PM to T approximately 16-fold. PM, LP, DA, TT, T, IP and MAN are as described in Figure 1.
Figure 8
Figure 8
Correlation of the microarray profile with the Q-PCR data from the corresponding transcript. Lines with the open circles represent microarray data, while lines with solid circles represent the Q-PCR data. The data for each transcript from the microarray is log base 2, RMA normalized and centered about its average across the seven stages, while the data for the Q-PCR is log base 2, normalized mRNA copies/μL and centered. Correlation values for each of the transcripts investigated using both technology platforms are indicated.

References

    1. Chao S, Sharp PJ, Worland AJ, Warham EJ, Koebner RMD, Gale MD. RFLP-based genetic maps of wheat homoeologous group 7 chromosomes. Theor Appl Genet. 1989;78:495–504. doi: 10.1007/BF00290833. - DOI - PubMed
    1. Hulbert SH, Richter TE, Axtell JD, Bennetzen JL. Genetic mapping and characterization of sorghum and related crops by means of maize DNA probes. Proc Natl Acad Sci USA. 1990;87:4251–4255. doi: 10.1073/pnas.87.11.4251. - DOI - PMC - PubMed
    1. Devos KM. Updating the 'crop circle'. Curr Opin Plant Biol. 2005;8:155–162. doi: 10.1016/j.pbi.2005.01.005. - DOI - PubMed
    1. Paterson AH, Bowers JE, Burow MD, Draye X, Elsik CG, Jiang CX, Katsar CS, Lan TH, Lin YR, Ming RG, Wright RJ. Comparative genomics of plant chromosomes. Plant Cell. 2000;12:1523–1540. doi: 10.1105/tpc.12.9.1523. - DOI - PMC - PubMed
    1. Francki M, Carter M, Ryan K, Hunter A, Bellgard M, Appels R. Comparative organization of wheat homoeologous group 3S and 7L using wheat-rice synteny and identification of potential markers for genes controlling xanthophyll content in wheat. Funct Integr Genom. 2004;4:118–130. doi: 10.1007/s10142-004-0110-5. - DOI - PubMed

Publication types