

Appropriate measures of influenza immunization program effectiveness
- PMID: 17052813
- PMCID: PMC7127273
- DOI: 10.1016/j.vaccine.2006.09.080
Appropriate measures of influenza immunization program effectiveness
Abstract
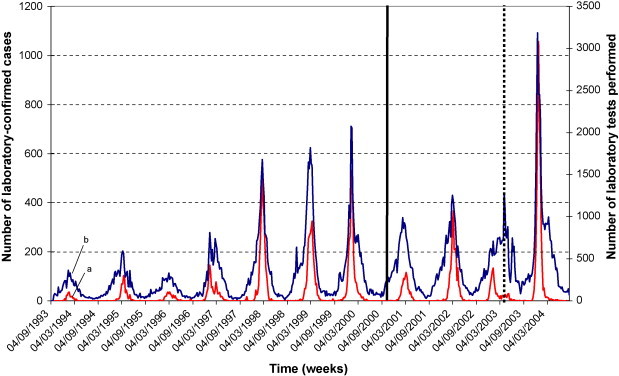
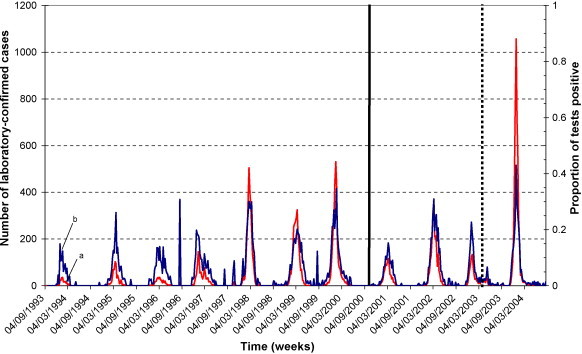
Groll and Thomson's evaluation of the effectiveness of Ontario's Universal Influenza Immunization Campaign used per capita cases of laboratory-confirmed influenza. We argue that these data are susceptible to various biases and should not be used as an outcome measure. Laboratory data are traditionally used to identify the presence of influenza activity rather than to identify levels of influenza activity. A better measure of viral activity is the proportion of influenza tests positive; whereas the weekly proportion of tests positive was relatively consistent, a marked increase over time in the numbers of laboratory-confirmed cases paralleled an increase in the number of tests performed. Regardless, for evaluating universal influenza immunization program effectiveness, other established and available measures employed in previous studies describing the epidemiology of influenza should be used instead of laboratory data.
Figures
Comment on
-
Incidence of influenza in Ontario following the Universal Influenza Immunization Campaign.Vaccine. 2006 Jun 12;24(24):5245-50. doi: 10.1016/j.vaccine.2006.03.067. Epub 2006 Apr 5. Vaccine. 2006. PMID: 16624458
References
-
- Groll D.L., Thomson D.J. Incidence of influenza in Ontario following the Universal Influenza Immunization Campaign. Vaccine. 2006;24(24):5245–5250. - PubMed
-
- Last J.M. 4th ed. Oxford University Press; New York: 2001. A dictionary of epidemiology.
-
- Poutanen S.M., Low D.E., Henry B. Identification of severe acute respiratory syndrome in Canada. N Engl J Med. 2003;348(20):1995–2005. - PubMed
-
- Svoboda T., Henry B., Shulman L. Public health measures to control the spread of the severe acute respiratory syndrome during the outbreak in Toronto. N Engl J Med. 2004;350(23):2352–2361. - PubMed
Publication types
MeSH terms
Substances
LinkOut - more resources
Full Text Sources
Medical
