. 2006 Oct 31;103(44):16496-501.
doi: 10.1073/pnas.0605835103. Epub 2006 Oct 19.

Mammalian reovirus, a nonfusogenic nonenveloped virus, forms size-selective pores in a model membrane

Affiliations

Mammalian reovirus, a nonfusogenic nonenveloped virus, forms size-selective pores in a model membrane

Melina A Agosto et al. Proc Natl Acad Sci U S A. .

Abstract

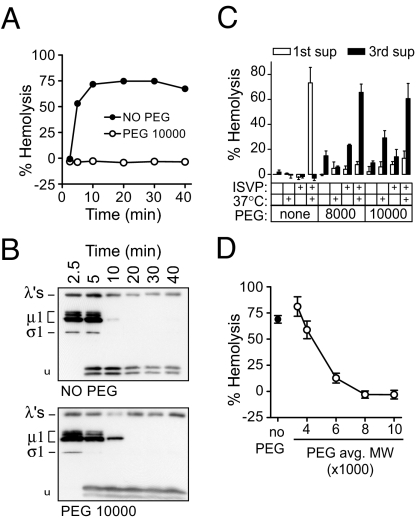
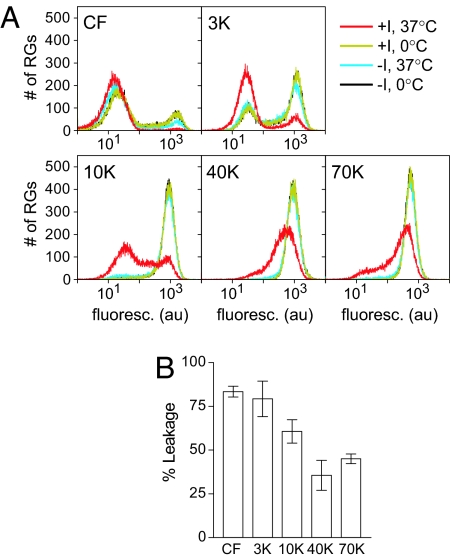
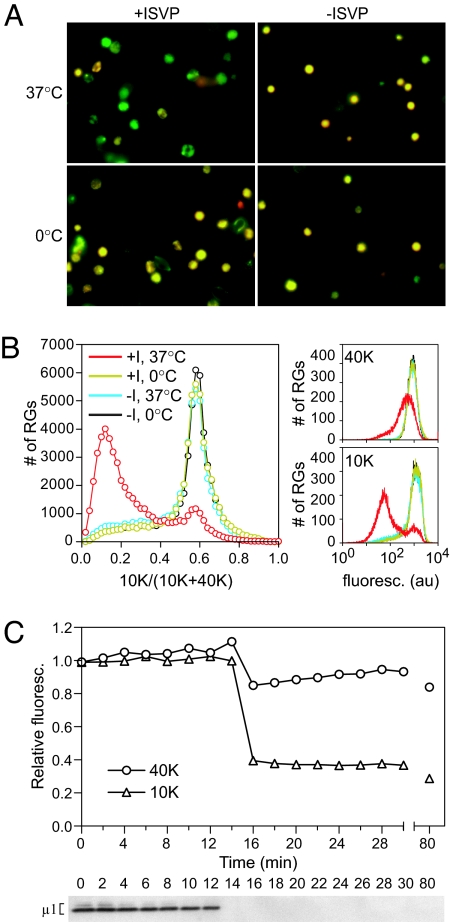
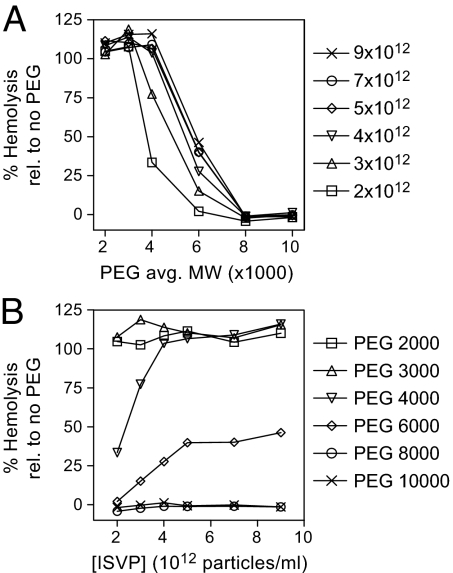
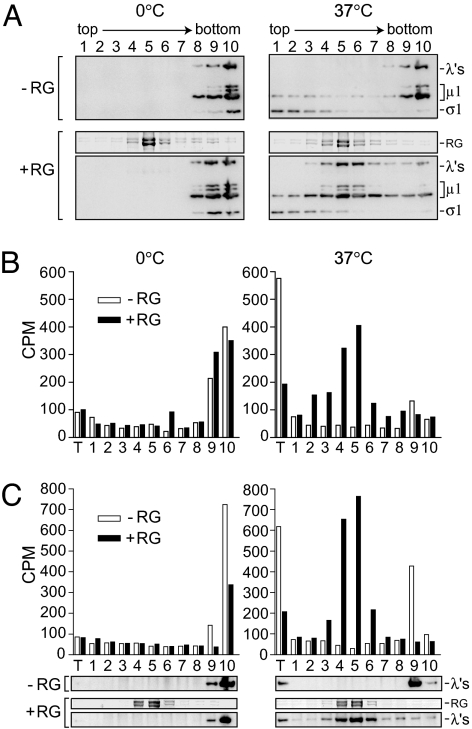
During cell entry, reovirus particles with a diameter of 70-80 nm must penetrate the cellular membrane to access the cytoplasm. The mechanism of penetration, without benefit of membrane fusion, is not well characterized for any such nonenveloped animal virus. Lysis of RBCs is an in vitro assay for the membrane perforation activity of reovirus; however, the mechanism of lysis has been unknown. In this report, osmotic-protection experiments using PEGs of different sizes revealed that reovirus-induced lysis of RBCs occurs osmotically, after formation of small size-selective lesions or "pores." Consistent results were obtained by monitoring leakage of fluorophore-tagged dextrans from the interior of resealed RBC ghosts. Gradient fractionations showed that whole virus particles, as well as the myristoylated fragment mu1N that is released from particles, are recruited to RBC membranes in association with pore formation. We propose that formation of small pores is a discrete, intermediate step in the reovirus membrane-penetration pathway, which may be shared by other nonenveloped animal viruses.


Conflict of interest statement

The authors declare no conflict of interest.

Figures

Fig. 1.
Fig. 1.
Inhibition of hemolysis by osmotic protection. (A) Hemolysis time courses were performed with or without 30 mM 10K-PEG. (B) Aliquots of supernatants from each time point in A were tested for protease-sensitivity of μ1. Arrowhead, trypsin-stable μ1 fragment. (C) Hemolysis reactions containing no PEG, 8K-PEG, or 10K-PEG were washed and resuspended in buffer with no PEG. (D) Hemolysis reactions were performed with PEGs of a range of sizes. Means ± SD of three experiments are shown.
Fig. 2.
Fig. 2.
Leakage of fluorescent dextrans from RGs. (A) Hemolysis-like reactions with RGs containing CF, or fluorescein-labeled dextran of the indicated size, were analyzed by flow cytometry. (B) Percentage of leakage was as described in Materials and Methods. Means ± SD of three experiments are shown.
Fig. 3.
Fig. 3.
Leakage of fluorescent dextran from doubly labeled RGs. (A) RG leakage reactions with RGs containing both Texas red-10K-dextran (red) and fluorescein-40K-dextran (green) were imaged by fluorescent microscopy. (B) Reactions with RGs containing both Alexa Fluor 647–10K-dextran and fluorescein-40K-dextran were analyzed by flow cytometry. (Left) Frequency distribution of the ratio of signal from the 10K label to total signal. (Right) Frequency distribution of signal from each label. (C) Time courses were performed with RGs containing double label as in B. At each time point, an aliquot was analyzed by flow cytometry (Upper). The mean fluorescence intensity is shown for each time point, relative to that of a no-ISVP control at the same time point. Each time point was also assayed for protease sensitivity of μ1 (Lower).
Fig. 4.
Fig. 4.
Effect of ISVP concentration on pore size. Hemolysis reactions with the indicated ISVP concentrations (particles per milliliter) were performed in the presence of PEGs of a range of sizes. For clarity, the data are shown both as a function of PEG size (Upper) and as a function of ISVP concentration (Lower). Mean values of two experiments are shown, as relative values with respect to the no PEG control for each ISVP concentration (100%).
Fig. 5.
Fig. 5.
Density sedimentation of RG leakage reactions. (A) Reactions performed with or without RGs were fractionated on Percoll gradients. Fractions were analyzed for virus particles by immunoblot, and gels were stained with Coomassie after transfer to indicate the location of RGs in the gradient (bands labeled “RG”). (B and C) RG leakage reactions performed with [3H]myristate-labeled ISVPs were fractionated, and each fraction was analyzed for the presence of myristoylated μ1N by scintillation counting. Two separate experiments are shown in B and C. The location of RGs and virus particles in the gradient are indicated (C Bottom) by Coomassie staining and immunoblot, respectively. T, material recovered from reaction tube.

References

    1. Harrison SC. Adv Virus Res. 2006;64:231–261. - PMC - PubMed
    1. Kielian M, Rey FA. Nat Rev Microbiol. 2006;4:67–76. - PMC - PubMed
    1. Weissenhorn W, Dessen A, Calder LJ, Harrison SC, Skehel JJ, Wiley DC. Mol Membr Biol. 1999;16:3–9. - PubMed
    1. Zhang X, Walker SB, Chipman PR, Nibert ML, Baker TS. Nat Struct Biol. 2003;10:1011–1018. - PMC - PubMed
    1. Tao Y, Farsetta DL, Nibert ML, Harrison SC. Cell. 2002;111:733–745. - PubMed

Publication types

LinkOut - more resources