

Stability of inbred mouse strain differences in behavior and brain size between laboratories and across decades
- PMID: 17053075
- PMCID: PMC1618164
- DOI: 10.1073/pnas.0605342103
Stability of inbred mouse strain differences in behavior and brain size between laboratories and across decades
Abstract
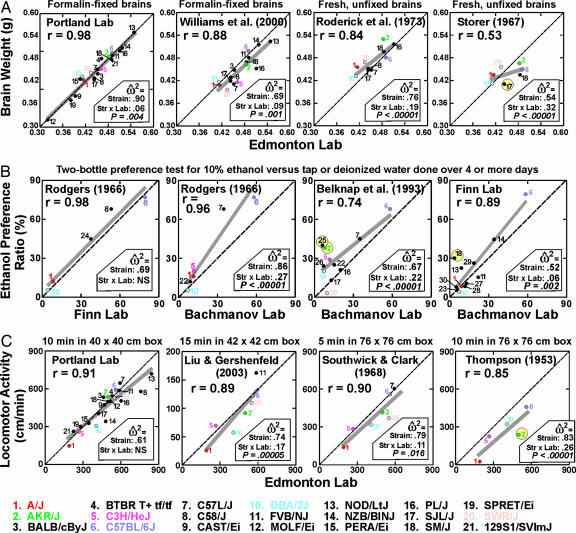
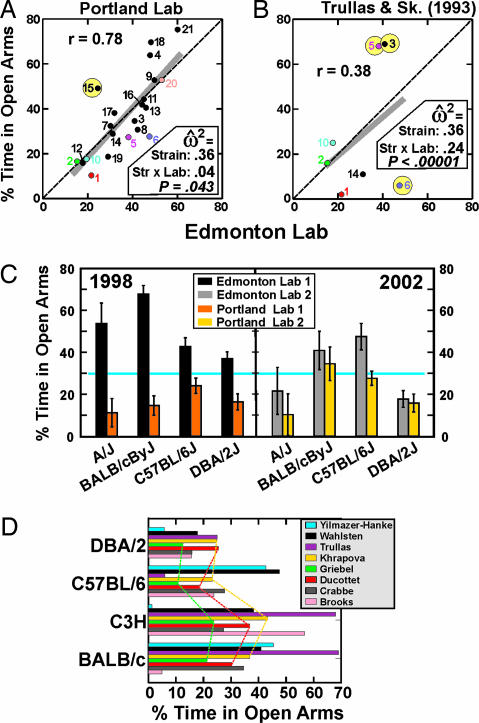
If we conduct the same experiment in two laboratories or repeat a classical study many years later, will we obtain the same results? Recent research with mice in neural and behavioral genetics yielded different results in different laboratories for certain phenotypes, and these findings suggested to some researchers that behavior may be too unstable for fine-scale genetic analysis. Here we expand the range of data on this question to additional laboratories and phenotypes, and, for the first time in this field, we formally compare recent data with experiments conducted 30-50 years ago. For ethanol preference and locomotor activity, strain differences have been highly stable over a period of 40-50 years, and most strain correlations are in the range of r = 0.85-0.98, as high as or higher than for brain weight. For anxiety-related behavior on the elevated plus maze, on the other hand, strain means often differ dramatically across laboratories or even when the same laboratory is moved to another site within a university. When a wide range of phenotypes is considered, no inbred strain appears to be exceptionally stable or labile across laboratories in any general sense, and there is no tendency to observe higher correlations among studies done more recently. Phenotypic drift over decades for most of the behaviors examined appears to be minimal.
Conflict of interest statement
The authors declare no conflict of interest.
Figures
References
Publication types
MeSH terms
Substances
Grants and funding
- AA 10760/AA/NIAAA NIH HHS/United States
- AA 134785/AA/NIAAA NIH HHS/United States
- U01 AA013478/AA/NIAAA NIH HHS/United States
- R01 AA012439/AA/NIAAA NIH HHS/United States
- P50 AA010760/AA/NIAAA NIH HHS/United States
- AA 12714/AA/NIAAA NIH HHS/United States
- R01 AA011028/AA/NIAAA NIH HHS/United States
- R01 DC000882/DC/NIDCD NIH HHS/United States
- U01 AA013519/AA/NIAAA NIH HHS/United States
- R01 AA012714/AA/NIAAA NIH HHS/United States
- AA 13478/AA/NIAAA NIH HHS/United States
- AA 12439/AA/NIAAA NIH HHS/United States
- P60 AA010760/AA/NIAAA NIH HHS/United States
- AA 10270/AA/NIAAA NIH HHS/United States
- AA 11028/AA/NIAAA NIH HHS/United States
- AA 13519/AA/NIAAA NIH HHS/United States
LinkOut - more resources
Full Text Sources
Molecular Biology Databases
