Comparative Study
. 2006 Dec;16(12):1517-28.
doi: 10.1101/gr.5655606. Epub 2006 Oct 19.

Whole-genome comparison of Leu3 binding in vitro and in vivo reveals the importance of nucleosome occupancy in target site selection

Affiliations
Comparative Study

Whole-genome comparison of Leu3 binding in vitro and in vivo reveals the importance of nucleosome occupancy in target site selection

Xiao Liu et al. Genome Res. 2006 Dec.

Abstract

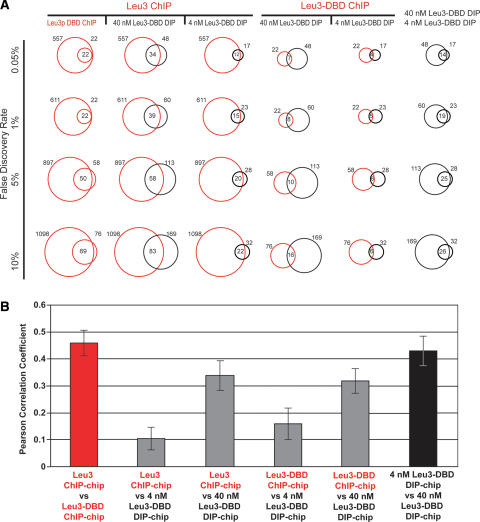
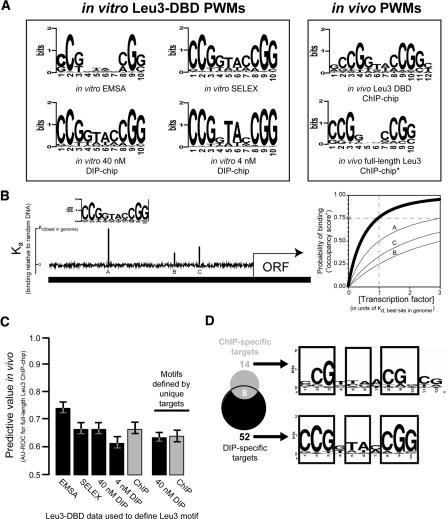
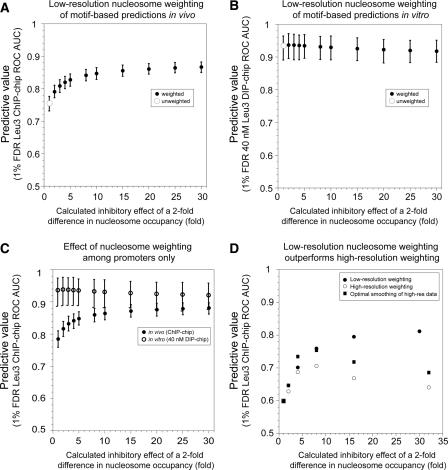
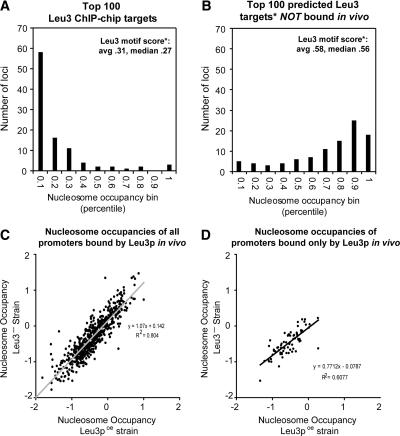
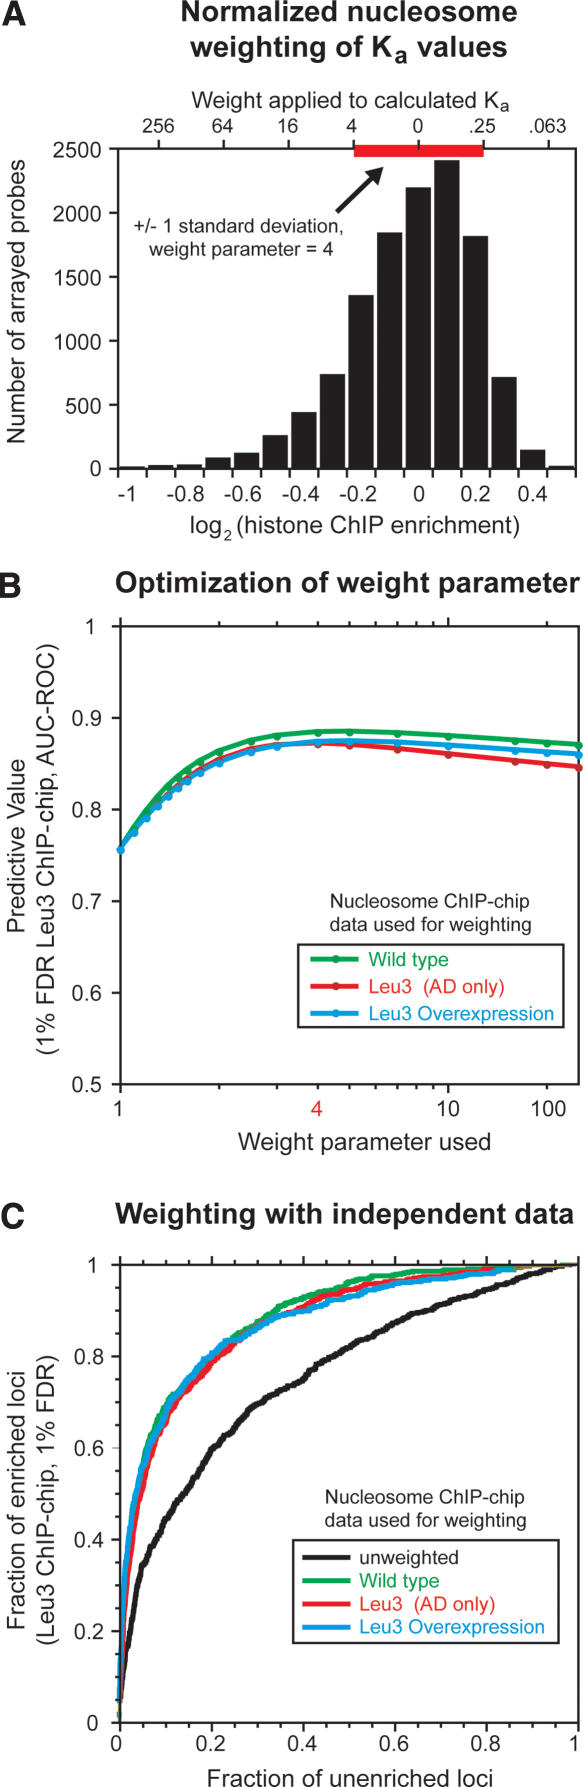
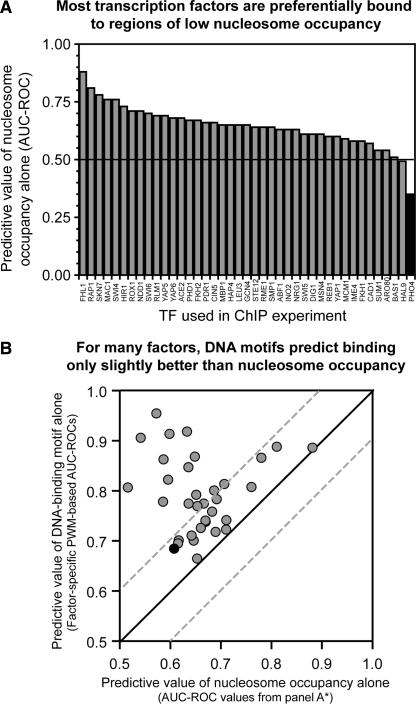
Sequence motifs that are potentially recognized by DNA-binding proteins occur far more often in genomic DNA than do observed in vivo protein-DNA interactions. To determine how chromatin influences the utilization of particular DNA-binding sites, we compared the in vivo genome-wide binding location of the yeast transcription factor Leu3 to the binding location observed on the same genomic DNA in the absence of any protein cofactors. We found that the DNA-sequence motif recognized by Leu3 in vitro and in vivo was functionally indistinguishable, but Leu3 bound different genomic locations under the two conditions. Accounting for nucleosome occupancy in addition to DNA-sequence motifs significantly improved the prediction of protein-DNA interactions in vivo, but not the prediction of sites bound by purified Leu3 in vitro. Use of histone modification data does not further improve binding predictions, presumably because their effect is already manifest in the global histone distribution. Measurements of nucleosome occupancy in strains that differ in Leu3 genotype show that low nucleosome occupancy at loci bound by Leu3 is not a consequence of Leu3 binding. These results permit quantitation of the epigenetic influence that chromatin exerts on DNA binding-site selection, and provide evidence for an instructive, functionally important role for nucleosome occupancy in determining patterns of regulatory factor targeting genome-wide.


Figures

Figure 1.
Figure 1.
Leu3 binds different genomic locations in vivo and in vitro. (A) Each vertical column contains comparisons of two Leu3 genomic binding experiments. Each horizontal row shows pairwise comparisons at the indicated FDR (0.05%, 1%, 5%, or 10%). FDRs were calculated based on P-values derived from a modified single-array error model (SAEM: Methods). Red circles represent the number of targets bound in the indicated in vivo ChIP-chip experiments, and black circles represent the number of targets bound in the indicated in vitro DIP-chip experiments. In all columns, the circle to the left corresponds to the upper-most label on the top row, while the circle to the right corresponds to the lower label. Numbers to the left and right of the circles indicate the total number of Leu3-bound loci. The number of Leu3-bound loci common to both experiments is indicated in the intersection of the circles. (B) In vivo experiments (red) and in vitro experiments (black) are more highly correlated with each other than are data across experiment types (gray). For each pairwise comparison, the Pearson’s correlation of all log (SAEM; P-values) is shown.
Figure 2.
Figure 2.
Motifs derived from in vitro methods predict in vivo protein–DNA interactions as accurately as motifs derived from in vivo ChIP-chip. (A) Six PWM representations of the Leu3 binding motif, derived from the indicated binding experiments (Methods). (B) A schematic representation of motif scoring by GOMER. Briefly, given a PWM for a binding motif N bp long, GOMER calculates a relative equilibrium binding constant (Kd) for each sequence window of length N in the genome, and from this Kd value calculates the probability of being bound at some free protein concentration (typically equal to the Kd of the best site in the genome). GOMER then uses these individual binding probabilities to calculate the probability of binding to at least one site within a genomic sequence of interest. The graph (right) indicates the probability that sites A, B, and C (left) will be occupied by a factor recognizing the motif shown, as a function of protein concentration. The thick line shows the probability that any one of the three sites will be bound at the given concentration. In this example, if the protein is present at a concentration equal to the Kd of the best site in the genome, there is a 75% chance that the shown promoter will be bound at either A, B, or C at a given point in time (gray circle). (C) AUC-ROC values (y-axis) for prediction of full-length Leu3 ChIP-chip results based on motifs derived from the indicated data set. Error bars indicate the 95% confidence interval estimated using bootstrap resampling of occupancy scores and Leu3 enrichments. (D) Similar motifs are derived from genomic targets unique to DIP or ChIP.
Figure 3.
Figure 3.
Accounting for nucleosome occupancy improves target prediction in vivo but not in vitro. Improvement of in vivo Leu3–DNA interaction prediction assuming an inhibitory effect of nucleosome occupancy. All Leu3 occupancy scores were calculated using the EMSA-derived PWM. (A) Different weighting factors are shown on the x-axis. Error bars indicate 95% confidence intervals calculated by bootstrap resampling (Methods). (B) For in vitro 40 nM DIP-chip data, weighting does not significantly improve the AUC-ROC value. (C) Same as A, but excluding ORFs and intergenic sequences that lie downstream from two convergently transcribed genes. The effects of weighting on full-length Leu3 ChIP-chip experiments (solid circles) and Leu3-DBD DIP-chip (open circles) are plotted. (D) Higher-resolution nucleosome occupancy data (Yuan et al. 2005) do not offer improvement in predictions over that achieved by low-resolution data. High-resolution data are restricted to chromosome III. Weighting with low-resolution data as in panel A yields a strong improvement in predictive power (black). However, higher-resolution data do not perform as well (open circles). The high-resolution data were most predictive when computationally “blurred” over 300 bp (squares).
Figure 4.
Figure 4.
Leu3-bound motifs are nucleosome-poor, but low nucleosome occupancy is not a consequence of Leu3 binding. (A) The 100 loci most highly enriched in Leu3 ChIP-chip experiments (by SAEM P-value) were divided into 10 bins according to their nucleosome occupancies relative to all other loci, as measured in a wild-type strain. The number of loci in each bin is shown on the y-axis. “Leu3 motif score” refers to the GOMER score of the arrayed locus (for all arrayed loci, the average was 0.09, median 0.06). (B) Same as A, except the 100 loci that had the highest predicted affinity to Leu3 and were not bound in vivo were plotted. Leu3 binding affinities were predicted using GOMER. (C) Nucleosome occupancy in strains overexpressing a gene encoding the Leu3 activation domain but no Leu3 binding domain (Leu3-, log2 ratios; y-axis) was highly correlated with nucleosome occupancy in strains overexpressing full-length Leu3 protein (Leu3poe, log2 ratios; x-axis). Thus, low nucleosome occupancy at Leu3-bound promoters is not dependent on Leu3 binding. The positive y-intercept and the slope slightly greater than 1 suggest there may be a subtle effect of Leu3 on nucleosome occupancy, but as shown in Figure 5, nucleosome occupancies determined in the absence of Leu3 are just as predictive of Leu3 binding as nucleosome occupancies determined in the presence of Leu3. (D) Same as C, but for the 76 Leu3 targets not bound by any other transcription factor (Lee et al. 2002; Harbison et al. 2004).
Figure 5.
Figure 5.
Quantitation of chromatin contributions to DNA binding-site utilization. (A) Histogram of histone ChIP-enrichment values and their use in weighting predicted Leu3 binding affinities. The plotted histone enrichment values are based on seven independent histone H3 and histone H4 ChIP-chip experiments (Methods) (Lee et al. 2004). The standard deviation of the combined distribution (red bar, ±1 standard deviation = 0.223 units) was used to determine the weight (upper x-axis) applied to a given log2 enrichment value (lower x-axis). Weights calculated at −4, −3, −2, −1, 0, 1, and 2 standard deviations from the median using a weight parameter of 4 are shown on the upper x-axis as an example. In the actual calculation used to weight motifs for the prediction of Leu3 binding, unbinned nucleosome occupancy values were used. Telomeric probes, mitochondrial probes, and probes for which no Leu3 ChIP data were available were excluded from the analysis. A small number of probes (∼0.2%) have histone ChIP-enrichment values that extend beyond the boundaries of this plot. The left and right edges of the red bar correspond to Z-scores of −1 and 1, respectively. (B) AUC-ROC at different weight parameters using nucleosome occupancy data obtained from the indicated strains. (C) ROC curves showing the effect of nucleosome occupancy weighting on the prediction of Leu3 binding in vivo. GOMER occupancy scores were calculated for all array probes using the Leu3 EMSA-derived PWM, weighted with nucleosome occupancy data from the strain indicated (green, wild type; red, overexpressed Leu3 activation domain [AD] only, with no Leu3 DNA binding activity; brown, overexpressed full-length Leu3). ROC curves plot the fraction of Leu3 ChIP-enriched probes (FDR = 1%) that exceed a given occupancy score versus the fraction of unenriched probes that meet the same threshold, effectively calculated at all possible threshold values. Nucleosome occupancies were normalized as described in A, and used to weight predicted Leu3 Ka values at a weight parameter of 4.
Figure 6.
Figure 6.
For many sequence-specific DNA-binding proteins, nucleosome occupancy alone predicts promoters bound in vivo almost as accurately as DNA sequence. (A) Most transcription factors are preferentially bound to regions of relatively low nucleosome occupancy. ROCs were used to quantitate the value of low nucleosome occupancy in predicting the in vivo distribution of the indicated transcription factors. ChIP-enriched sequences (Lee et al. 2002) were defined at 10% FDR. Only the 41 ChIPs yielding at least 20 enriched sequences were analyzed. Pho4 (black) appears to be significantly associated with regions of higher nucleosome occupancy, possibly because of different growth conditions under which ChIP-chip and nucleosome data were collected. (B) Motifs derived from bound sequences often predict binding only slightly better (within an AUC-ROC of 0.1) than does nucleosome occupancy alone. Of the 41 factors in A, a significant DNA-sequence motif could be derived for the 34 plotted here (see Supplemental Table 2 for tabular data). PWMs were used to calculate occupancy scores for every intergenic region. ROCs were then used to quantitate the ability of the occupancy scores derived from the factor-specific motifs to predict the in vivo distribution of the corresponding factor (y-axis). On the x-axis are the nucleosome-occupancy-based AUC-ROCs. AUC-ROC values under 0.5 were converted to (1 − AUC-ROC). Of the transcription factors, 17/34 fall between dashed lines, which indicate AUC-ROC values within 0.1. (Filled black circle) Pho4.

References

    1. Almer A., Rudolph H., Hinnen A., Horz W., Rudolph H., Hinnen A., Horz W., Hinnen A., Horz W., Horz W. Removal of positioned nucleosomes from the yeast PHO5 promoter upon PHO5 induction releases additional upstream activating DNA elements. EMBO J. 1986;5:2689–2696. - PMC - PubMed
    1. Brachmann C.B., Davies A., Cost G.J., Caputo E., Li J., Hieter P., Boeke J.D., Davies A., Cost G.J., Caputo E., Li J., Hieter P., Boeke J.D., Cost G.J., Caputo E., Li J., Hieter P., Boeke J.D., Caputo E., Li J., Hieter P., Boeke J.D., Li J., Hieter P., Boeke J.D., Hieter P., Boeke J.D., Boeke J.D. Designer deletion strains derived from Saccharomyces cerevisiae S288C: A useful set of strains and plasmids for PCR-mediated gene disruption and other applications. Yeast. 1998;14:115–132. - PubMed
    1. Friden P., Schimmel P., Schimmel P. LEU3 of Saccharomyces cerevisiae activates multiple genes for branched-chain amino acid biosynthesis by binding to a common decanucleotide core sequence. Mol. Cell. Biol. 1988;8:2690–2697. - PMC - PubMed
    1. Fried M., Crothers D.M., Crothers D.M. Equilibria and kinetics of lac repressor–operator interactions by polyacrylamide gel electrophoresis. Nucleic Acids Res. 1981;9:6505–6525. - PMC - PubMed
    1. Ghaemmaghami S., Huh W.K., Bower K., Howson R.W., Belle A., Dephoure N., O’Shea E.K., Weissman J.S., Huh W.K., Bower K., Howson R.W., Belle A., Dephoure N., O’Shea E.K., Weissman J.S., Bower K., Howson R.W., Belle A., Dephoure N., O’Shea E.K., Weissman J.S., Howson R.W., Belle A., Dephoure N., O’Shea E.K., Weissman J.S., Belle A., Dephoure N., O’Shea E.K., Weissman J.S., Dephoure N., O’Shea E.K., Weissman J.S., O’Shea E.K., Weissman J.S., Weissman J.S. Global analysis of protein expression in yeast. Nature. 2003;425:737–741. - PubMed

Publication types

MeSH terms