Comparative Study
. 2006 Oct 20:7:268.
doi: 10.1186/1471-2164-7-268.

Gene expressions and copy numbers associated with metastatic phenotypes of uterine cervical cancer

Affiliations
Comparative Study

Gene expressions and copy numbers associated with metastatic phenotypes of uterine cervical cancer

Heidi Lyng et al. BMC Genomics. .

Abstract

Background: A better understanding of the development of metastatic disease and the identification of molecular markers for cancer spread would be useful for the design of improved treatment strategies. This study was conducted to identify gene expressions associated with metastatic phenotypes of locally advanced cervical carcinomas and investigate whether gains or losses of these genes could play a role in regulation of the transcripts. Gene expressions and copy number changes were determined in primary tumors from 29 patients with and 19 without diagnosed lymph node metastases by use of cDNA and genomic microarray techniques, respectively.

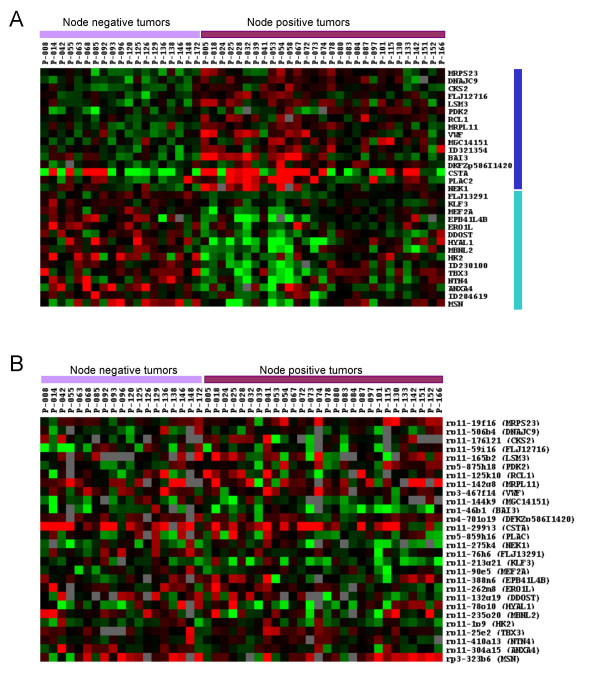
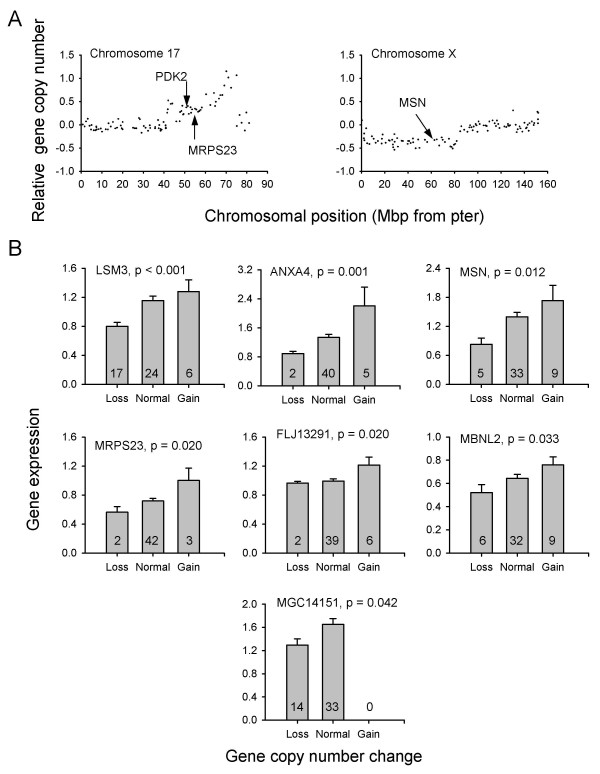
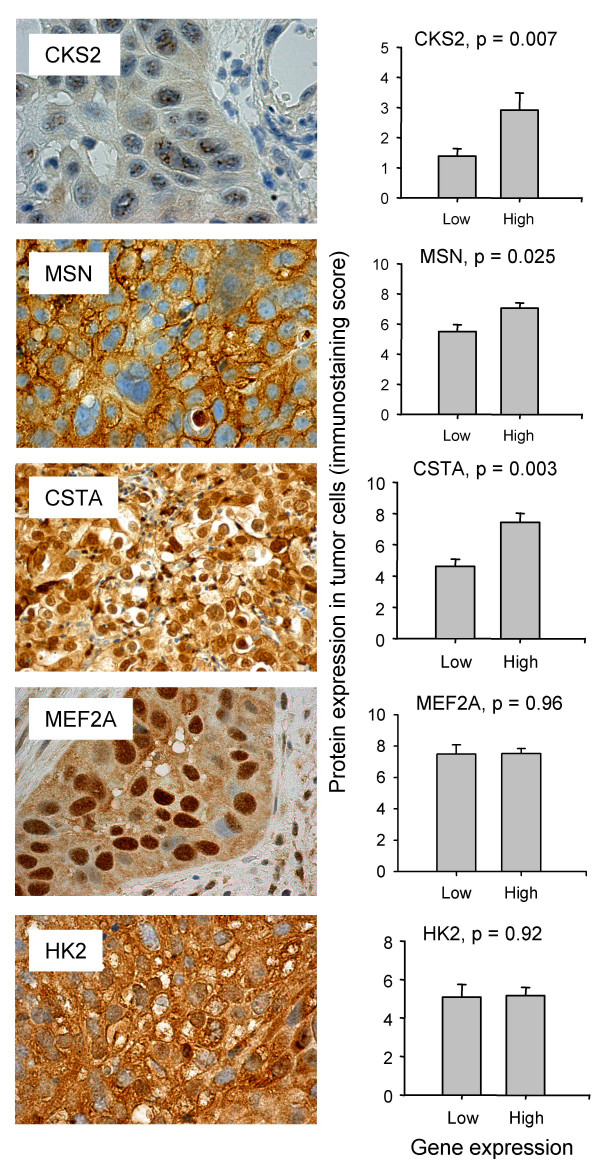
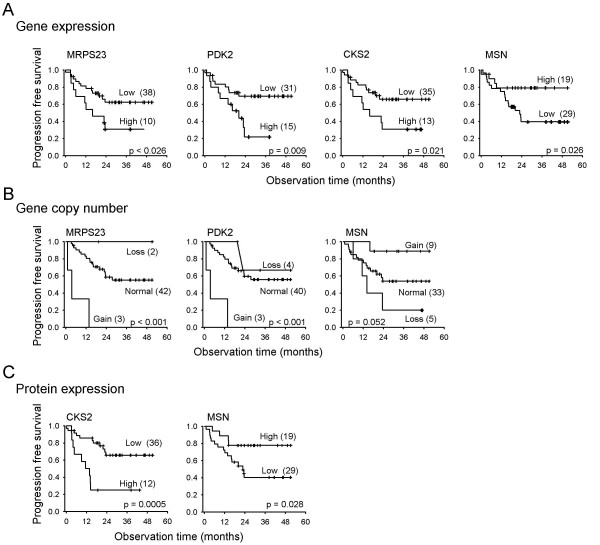
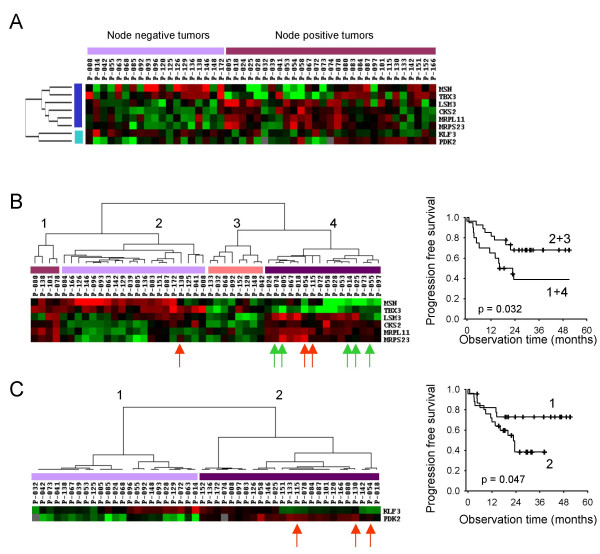
Results: Thirty-one genes that differed in expression between the node positive and negative tumors were identified. Expressions of eight of these genes (MRPL11, CKS2, PDK2, MRPS23, MSN, TBX3, KLF3, LSM3) correlated with progression free survival in univariate analysis and were therefore more strongly associated with metastatic phenotypes than the others. Immunohistochemistry data of CKS2 and MSN showed similar relationships to survival. The prognostic genes clustered into two groups, suggesting two major metastatic phenotypes. One group was associated with rapid proliferation, oxidative phosphorylation, invasiveness, and tumor size (MRPS23, MRPL11, CKS2, LSM3, TBX3, MSN) and another with hypoxia tolerance, anaerobic metabolism, and high lactate content (PDK2, KLF3). Multivariate analysis identified tumor volume and PDK2 expression as independent prognostic variables. Gene copy number changes of the differentially expressed genes were not frequent, but correlated with the expression level for seven genes, including MRPS23, MSN, and LSM3.

Conclusion: Gene expressions associated with known metastatic phenotypes of cervical cancers were identified. Our findings may indicate molecular mechanisms underlying development of these phenotypes and be useful as markers of cancer spread. Gains or losses of the genes may be involved in development of the metastatic phenotypes in some cases, but other mechanisms for transcriptional regulation are probably important in the majority of tumors.


Figures

Figure 1
Figure 1
Gene expressions and copy numbers in node negative and positive tumors. A, Expression ratios of 31 genes that differed in expression between 19 node negative and 29 node positive cervical tumors. The data are the average log2ratio of two dye-swap experiments. Gene symbols (NCBI UniGene) are shown to the right. The genes indicated with a dark blue line were upregulated in node positive compared to node negative tumors, whereas those marked light blue were downregulated. The ratios were median centered, and expressions higher and lower than the median expression of that gene are shown in red and green, respectively. The most intense colors represent log2ratios of > 2.0 (red) and < -2.0 (green) relative to the median, whereas black represents expression close to the median value. B, Gene copy number relative to modal DNA content (log2ratio) of the BAC clones covering or are close to the genes in (A) for the patients presented in (A). Patient P-058 is not included, since tumor DNA was not available. BAC clone identifications and the corresponding gene symbols (NCBI UniGene) are shown to the right. Gene gains and losses are shown in red and green, respectively, whereas black represents no aberration. The most intense red and green colors represent log2ratios of > 0.8 and < -0.8, respectively. The log2ratios varied between -0.84 and 2.19.
Figure 2
Figure 2
Gene copy numbers in relation to gene expressions. A, Gene copy number relative to model DNA content (log2ratio) versus position on chromosome 17 (left panel) and chromosome X (right panel), demonstrating gain of PDK2 and MRPS23 (chromosome 17) and loss of MSN (chromosome X) in two different cervical tumors. Each point represents the data for a BAC clone on the genomic microarray. For identification of gains and losses the relative copy number of neighboring clones was always considered in addition to that of the clone of interest. All amplified or deleted regions contained at least three clones. B, Gene expressions (absolute scale) in 47 tumors with loss, no aberration (normal), or gain of LSM3, ANXA4, MSN, MRPS23, FLJ13291, MBNL2, and MGC14151. These genes were the ones with a significant correlation between gene expression and copy number. The chromosomal location of the genes is listed in Table 1. Columns, mean values for all tumors in the groups; bars, standard errors. P-values for the correlations and number of tumors in each group are indicated.
Figure 3
Figure 3
Protein expressions in relation to gene expressions. Immunostaining of CKS2 (nuclear), MSN (membrane/cytoplasmic), CSTA (nuclear/cytoplasmic), MEF2A (nuclear/cytoplasmic), and HK2 (cytoplasmic) in cervical tumors with high protein levels (left panels) and immunostaining score in 48 cervical tumors with low or high gene expression of CKS2, MSN, CSTA, MEF2A, and HK2 (right panels). MSN, MEF2A, and HK2 were expressed in both tumor and stroma cells, and only the immunostaining in tumor cells is included in the histograms. For CKS2 and CSTA, which were upregulated in node positive tumors, the histograms compares the immunostaining score between the quartile of tumors (n = 12) with the highest gene expression and the remaining 36 ones. For HK2, MEF2A, and MSN, which were downregulated in node positive tumors, the immunostaining score between the quartile of tumors with lowest gene expression and the remaining 36 ones is compared. Columns, mean values for all tumors in the groups; bars, standard errors. P-values for the correlations are indicated.
Figure 4
Figure 4
Progression free survival analysis. Kaplan Meier plots of progression free survival for 48 cervical cancer patients with high or low gene expression of MRPS23, PDK2, CKS2, and MSN (A), with loss, gain, or no change in gene copy number of MRPS23, PDK2, and MSN (B), and with high or low protein expression of CKS2 and MSN in the tumor cells (C). Number of patients in each group and p-value in log rank test are indicated. The p-values in (A) differ slightly from that in Table 2 because log-rank tests are used in (A), whereas the data in Table 2 are based on Cox regression analysis. Note the concordance in the results based on gene expressions, copy numbers, and protein expressions.
Figure 5
Figure 5
Cluster analysis of genes and patients. A, Cluster diagram of MSN, TBX3, LSM3, CKS2, MRPL11, MRPS23, KLF3, and PDK2 expression in 19 node negative and 29 node positive cervical tumors. B, Cluster diagram of 48 cervical tumors based on MSN, TBX3, LSM3, CKS2, MRPL11, and MRPS23 expression (left) and Kaplan Meier plots of progression free survival for patients in group 1 and 4 (high expression of MRPL11, MRPS23, CKS2, and LSM3 and low expression of MSN and TBX3) versus group 2 and 3 (low expression of MRPL11, MRPS23, CKS2, and LSM3 and high expression of MSN and TBX3) (right). C, Cluster diagram of 48 cervical tumors based on KLF3 and PDK2 expression (left) and Kaplan Meier plots of progression free survival for patients in group 1 (high expression of KLF3 and low expression of PDK2) versus groups 2 (low expression of KLF3 and high expression of PDK2) (right). Clustering was performed based on the log2ratios, using absolute Pearson correlation (A) or Pearson correlation (B, C) algorithms. The ratios were median centered, and expressions higher and lower than the median expression of that gene are shown in red and green, respectively. The most intense colors represent log2ratios of > 1.0 (red) and < -1.0 (green) relative to the median value, whereas black represents expression close to median. Arrows point to patients with gain of MRPS23 and PDK2 (red) or loss of MSN (green). Group numbers and p-value in log rank test are indicated in the Kaplan Meier plots.

References

    1. Eccles SA. Cell biology of lymphatic metastasis. The potential role of c-erbB oncogene signalling. Recent Results Cancer Res. 2000;157:41–54. - PubMed
    1. Roepman P, Wessels LF, Kettelarij N, Kemmeren P, Miles AJ, Lijnzaad P, Tilanus MG, Koole R, Hordijk GJ, van der Vliet PC, Reinders MJ, Slootweg PJ, Holstege FC. An expression profile for diagnosis of lymph node metastases from primary head and neck squamous cell carcinomas. Nat Genet. 2005;37:182–186. doi: 10.1038/ng1502. - DOI - PubMed
    1. Fyles A, Milosevic M, Hedley D, Pintilie M, Levin W, Manchul L, Hill RP. Tumor hypoxia has independent predictor impact only in patients with node-negative cervix cancer. J Clin Oncol. 2002;20:680–687. doi: 10.1200/JCO.20.3.680. - DOI - PubMed
    1. Hockel M, Schlenger K, Hockel S, Vaupel P. Hypoxic cervical cancers with low apoptotic index are highly aggressive. Cancer Res. 1999;59:4525–4528. - PubMed
    1. Lyng H, Sundfor K, Trope C, Rofstad EK. Disease control of uterine cervical cancer: relationships to tumor oxygen tension, vascular density, cell density, and frequency of mitosis and apoptosis measured before treatment and during radiotherapy. Clin Cancer Res. 2000;6:1104–1112. - PubMed

Publication types

MeSH terms