. 2006;8(5):R58.
doi: 10.1186/bcr1608.

Gene expression signatures of morphologically normal breast tissue identify basal-like tumors

Affiliations

Gene expression signatures of morphologically normal breast tissue identify basal-like tumors

Greg Finak et al. Breast Cancer Res. 2006.

Abstract

Introduction: The role of the cellular microenvironment in breast tumorigenesis has become an important research area. However, little is known about gene expression in histologically normal tissue adjacent to breast tumor, if this is influenced by the tumor, and how this compares with non-tumor-bearing breast tissue.

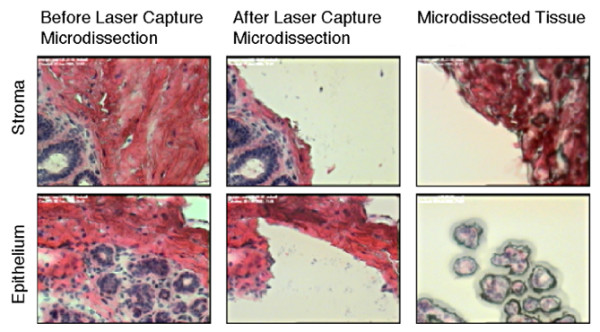
Methods: To address this, we have generated gene expression profiles of morphologically normal epithelial and stromal tissue, isolated using laser capture microdissection, from patients with breast cancer or undergoing breast reduction mammoplasty (n = 44).

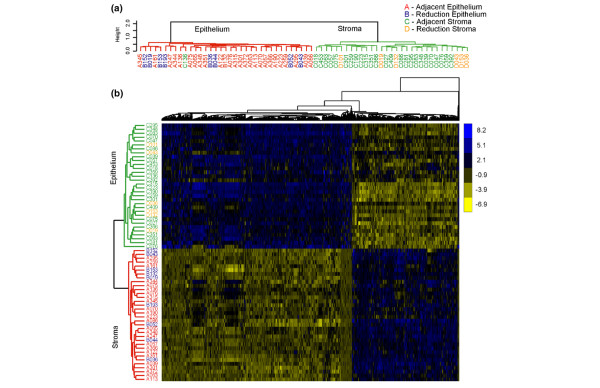
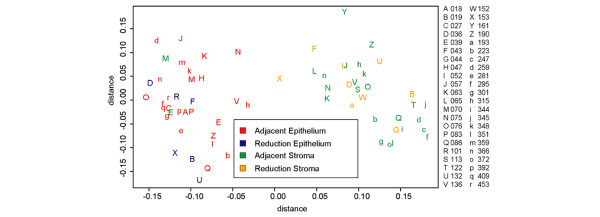
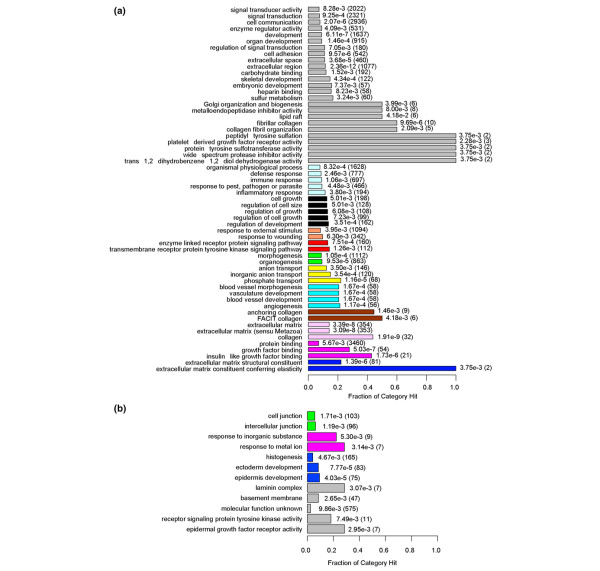
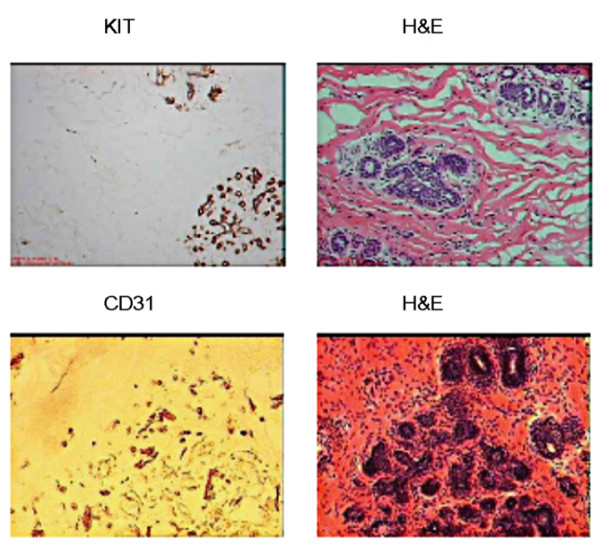
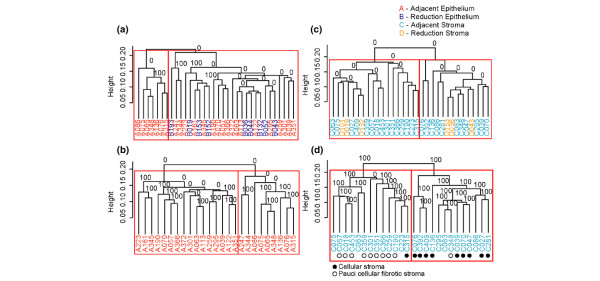
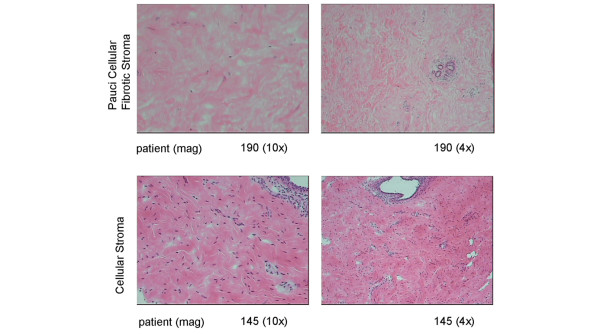
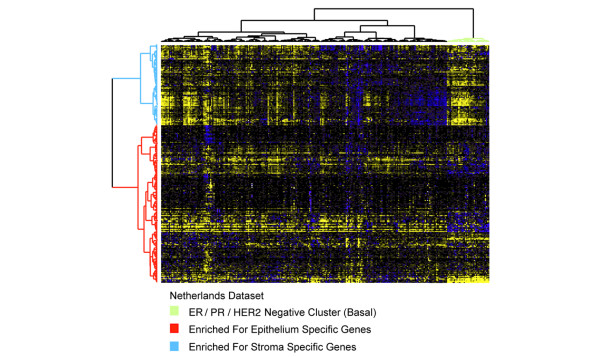
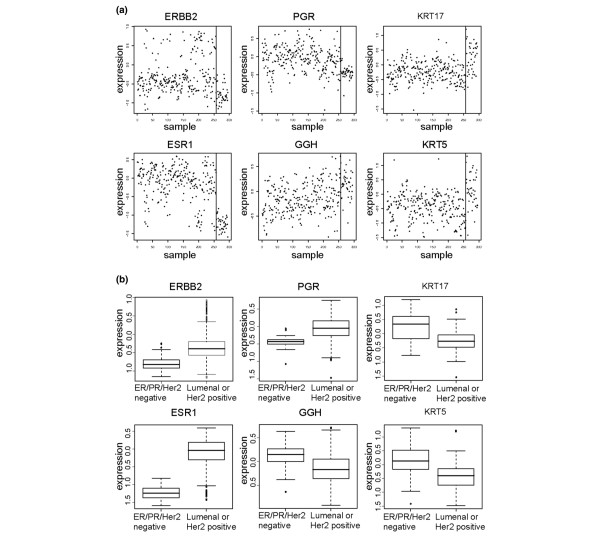
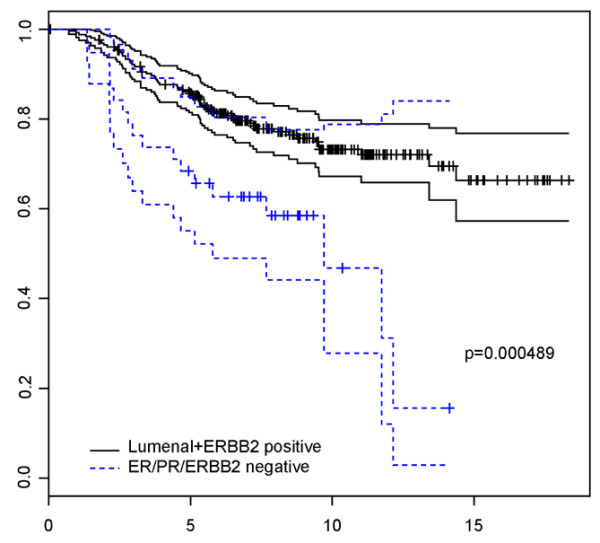
Results: Based on this data, we determined that morphologically normal epithelium and stroma exhibited distinct expression profiles, but molecular signatures that distinguished breast reduction tissue from tumor-adjacent normal tissue were absent. Stroma isolated from morphologically normal ducts adjacent to tumor tissue contained two distinct expression profiles that correlated with stromal cellularity, and shared similarities with soft tissue tumors with favorable outcome. Adjacent normal epithelium and stroma from breast cancer patients showed no significant association between expression profiles and standard clinical characteristics, but did cluster ER/PR/HER2-negative breast cancers with basal-like subtype expression profiles with poor prognosis.

Conclusion: Our data reveal that morphologically normal tissue adjacent to breast carcinomas has not undergone significant gene expression changes when compared to breast reduction tissue, and provide an important gene expression dataset for comparative studies of tumor expression profiles.


Figures

Figure 1
Figure 1
Laser-capture microdissection of epithelium and stroma from normal breast specimens. Frozen tissue sections (10 micron) stained with hematoxylin and eosin.
Figure 2
Figure 2
Hierarchical clustering and heatmap showing the segregation of samples by tissue type. (a) Hierarchical clustering of normal tissue samples shows segregation by tissue type (red, adjacent epithelium; blue, reduction epithelium; green, adjacent stroma; orange, reduction stroma). (b) Heatmap showing tissue specific gene expression clusters.
Figure 3
Figure 3
Multidimensional scaling of normal stroma and normal epithelium. Two tissue-specific clusters are observed. Adjacent and reduction tissue do not segregate into separate clusters. The epithelial tissue cluster contains two adjacent stroma sample outliers.
Figure 4
Figure 4
Gene Ontology (GO) categories overrepresented in the normal stroma and normal epithelium gene signatures. (a) GO terms overrepresented by genes expressed in normal stroma. (b) GO terms overrepresented by genes expressed in normal epithelium. Bars represent the fraction of genes in the category that were expressed. Terms of the same color are related in the GO hierarchy (gray terms are unrelated). P values for significance, and the total number of genes in a category are listed after the bar plot.
Figure 5
Figure 5
Immunostaining of normal breast tissue with anti-c-kit and anti-CD31. H&E, hematoxylin and eosin.
Figure 6
Figure 6
Hierarchical clustering with bootstrapping of adjacent and reduction breast tissues from gene expression data. (a) Hierarchical clustering with bootstrapping of adjacent and reduction epithelium. (b) Histologically normal adjacent and reduction stroma. (c) Histologically normal adjacent epithelium. (d) Histologically normal adjacent stroma. We used 10,000 bootstrap iterations to obtain significance scores for the observed clusters. Nodes are labeled with the percentage of times that the cluster is observed by bootstrapping. Only adjacent stroma showed statistically significant clusters at the top level. Red boxes indicate the top-level clusters that were tested for association with clinical characteristics of the samples.
Figure 7
Figure 7
Images of pauci cellular fibrotic and cellular stroma sections from selected patients. Images were taken at 4× and 10× magnification.
Figure 8
Figure 8
Heatmap of a cancer dataset [8] clustered using the normal gene signature. This signature identifies a distinct cluster of 38 estrogen receptor (ER)/progesterone receptor (PR) negative, HER2 negative samples corresponding to the basal breast cancer subtype [35]. Elevated expression of normal stroma-specific genes appears in a portion of the lumenal and HER2 positive tumors, although this expression does not correlate with the known molecular subtypes of breast cancer.
Figure 9
Figure 9
Expression of selected subtype specific markers in the breast cancer dataset [8]. (a) The y-axis shows the expression level of the gene, while the x-axis identifies each sample, ordered as in Figure 8. The vertical line shows the separation between sample clusters found in Figure 8. The right-most cluster shows decreased expression of estrogen receptor (ESR), HER2, and progesterone receptor (PGR) in most samples, and increased expression of keratin (KRT) 5 and gamma-glutamyl hydrolase (GGH). These markers are indicative of a mixture of basal-like and normal-like tumor subtypes. (b) Box plots showing the distributions of expression for subtype markers in the two observed clusters.
Figure 10
Figure 10
Survival analysis of the two sample clusters identified from the cancer data set [8]. The clusters were generated from the normal breast tissue signature. The estrogen receptor (ER)/progesterone receptor (PR)/ERBB2 negative cluster consisting of 38 samples shows poor survival compared to the remaining samples consisting of Lumenal and ERBB2 positive tumors (p = 0.000489).

References

    1. Edwards BK, Brown ML, Wingo PA, Howe HL, Ward E, Ries LA, Schrag D, Jamison PM, Jemal A, Wu XC, et al. Annual report to the nation on the status of cancer, 1975–2002, featuring population-based trends in cancer treatment. J Natl Cancer Inst. 2005;97:1407–1427. - PubMed
    1. Elston CW, Ellis IO. Pathological prognostic factors in breast cancer. I. The value of histological grade in breast cancer: experience from a large study with long-term follow-up. Histopathology. 1991;19:403–410. - PubMed
    1. Henson DE, Ries L, Freedman LS, Carriaga M. Relationship among outcome, stage of disease, and histologic grade for 22,616 cases of breast cancer. The basis for a prognostic index. Cancer. 1991;68:2142–2149. doi: 10.1002/1097-0142(19911115)68:10<2142::AID-CNCR2820681010>3.0.CO;2-D. - DOI - PubMed
    1. Shek LL, Godolphin W, Spinelli JJ. Oestrogen receptors, nodes and stage as predictors of post-recurrence survival in 457 breast cancer patients. Br J Cancer. 1987;56:825–829. - PMC - PubMed
    1. Torregrosa D, Bolufer P, Lluch A, Lopez JA, Barragan E, Ruiz A, Guillem V, Munarriz B, Garcia Conde J. Prognostic significance of c-erbB-2/neu amplification and epidermal growth factor receptor (EGFR) in primary breast cancer and their relation to estradiol receptor (ER) status. Clin Chim Acta. 1997;262:99–119. doi: 10.1016/S0009-8981(97)06542-X. - DOI - PubMed

Publication types