. 2006 Oct 31;103(44):16466-71.
doi: 10.1073/pnas.0607668103. Epub 2006 Oct 20.

Angiogenesis-independent tumor growth mediated by stem-like cancer cells

Affiliations

Angiogenesis-independent tumor growth mediated by stem-like cancer cells

Per Ø Sakariassen et al. Proc Natl Acad Sci U S A. .

Abstract

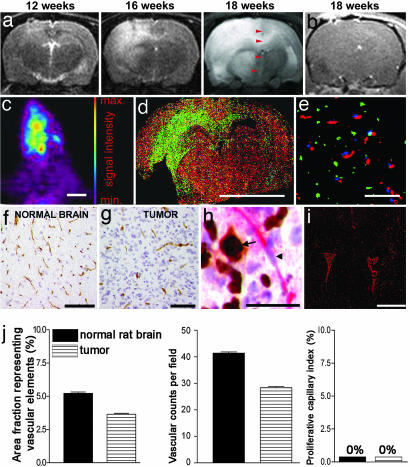
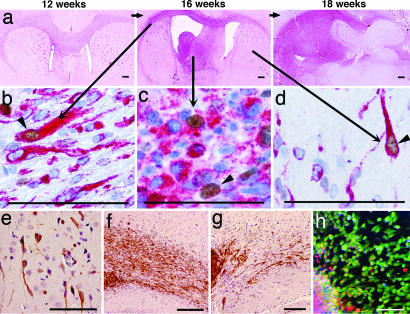
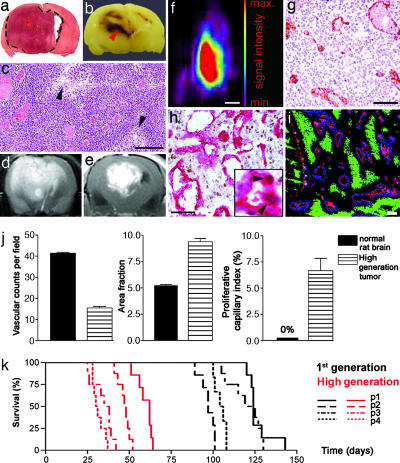
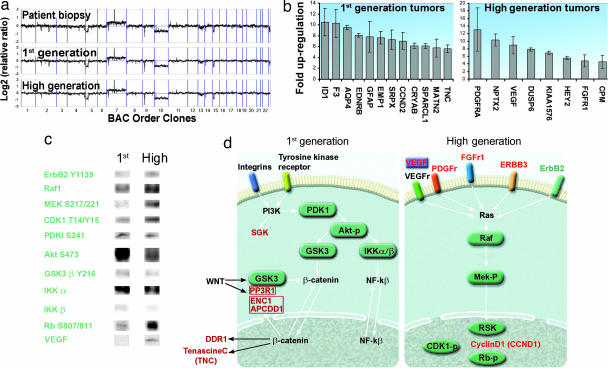
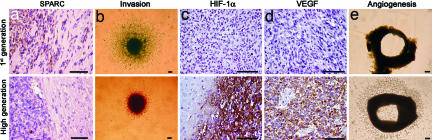
In this work, highly infiltrative brain tumors with a stem-like phenotype were established by xenotransplantation of human brain tumors in immunodeficient nude rats. These tumors coopted the host vasculature and presented as an aggressive disease without signs of angiogenesis. The malignant cells expressed neural stem cell markers, showed a migratory behavior similar to normal human neural stem cells, and gave rise to tumors in vivo after regrafting. Serial passages in animals gradually transformed the tumors into an angiogenesis-dependent phenotype. This process was characterized by a reduction in stem cells markers. Gene expression profiling combined with high throughput immunoblotting analyses of the angiogenic and nonangiogenic tumors identified distinct signaling networks in the two phenotypes. Furthermore, proinvasive genes were up-regulated and angiogenesis signaling genes were down-regulated in the stem-like tumors. In contrast, proinvasive genes were down-regulated in the angiogenesis-dependent tumors derived from the stem-like tumors. The described angiogenesis-independent tumor growth and the uncoupling of invasion and angiogenesis, represented by the stem-like cancer cells and the cells derived from them, respectively, point at two completely independent mechanisms that drive tumor progression. This article underlines the need for developing therapies that specifically target the stem-like cell pools in tumors.


Conflict of interest statement

The authors declare no conflict of interest.

Figures

Fig. 1.
Fig. 1.
Tumor growth without angiogenesis. (a) MRI scans (T2 sequence) at three different time points. The midline structure at 18 weeks, as indicated by arrowheads. (b) T1 sequence after gadodiamid administration. (c) A [18F]FLT positron emission tomography scan of a rat brain with a tumor. (d) Coronary rat brain section costained with BrdU (green) and collagen IV (red). (e) Triple staining of the tumor bed for BrdU (green), collagen IV (red), and Hoechst (blue). (f) CD31 staining of vessels in the normal brain. (g) CD31 staining of vessels in the tumor. (h) Costaining for von Willebrand factor (red) and Ki67 (brown). Ki67-positive tumor cell nucleus (arrow), and Ki67-negative endothelial nucleus (arrowhead) are shown. (i) Double staining for collagen IV (red) and pimonidazol (green). (j) Morphometric quantification of vascular parameters in the first-generation tumors and in the normal brain. Error bars show SEM. [Scale bars: 1 cm (c and d); 100 μm (e–g); 40 μm (h); and 5 mm (i).]
Fig. 2.
Fig. 2.
Nonangiogenic tumors contain cells with stem-like features. (a) Brain sections at different time points corresponding to the MRI scans. The main tumor mass has a purple color because of immunostaining with a human-specific antibody against vimentin. Costaining with anti-human vimentin (red) and Ki67 (brown) show dividing and nondividing tumor cells in different regions of the brain: corpus callosum (b), tumor bulk (c), and contralateral hemisphere (d). (e) Nestin-positive cancer cells (brown) invading the parenchyma in the contralateral hemisphere. (f and g) Migration along corpus callosum of vimentin-positive cancer cells (brown) from a tumor spheroid (f) and of human neural stem cells (g). (h) Musashi-1-positive cells (green) migrating from a tumor spheroid (red). (Scale bars: 50 μm.)
Fig. 3.
Fig. 3.
Angiogenesis-independent stem-like tumors progress to become vascular and necrotic tumors. (a) H&E staining of a high-generation tumor. Dashed lines indicate the tumor periphery. (b) Picture of the same tumor exhibiting macroscopic necrosis (arrowhead). (c) H&E staining of a high-generation tumor at high magnification with enlarged vessels and arrowheads indicating necrotic areas. (d and e) T2-weighted (d) and gadodiamid-enhanced T1-weighted (e) MRI scans of a high-generation tumor. White area in e represents contrast enhancement. (f) Positron emission tomography scan of the rat brain tumor. (Scale bar: 1 cm.) (g) CD31 staining (brown) of the tumor bed. (h) Costaining for von Willebrand (red) and Ki67 (brown). (Inset) Proliferating endothelial cells (arrowheads). (i) Triple staining of a tumor section against pimonidazol (green), collagen IV (red), and Hoechst (blue). (j) Quantification of vascular parameters and comparison with normal brain. (k) Kaplan–Meyer curves presenting survival data for animals grafted with four patient biopsies that were passaged from first- to high-generation. (Scale bars: 100 μm, unless otherwise indicated.)
Fig. 4.
Fig. 4.
Comparison of chromosomal DNA, gene expression, and protein profiles between first- and high-generation tumors. (a) Array CGH showing the relative chromosome copy numbers of the parent biopsy, first- and high-generation tumors. (b) Bar graph presenting the genes with the biggest difference in expression levels between the first- and high-generation tumors. (c) Immunoblot analysis of protein extracts from first- and high-generation tumor tissue. VEGF was analyzed from cerebrospinal fluid. (d) Signaling pathways differentially activated in the two tumor phenotypes.
Fig. 5.
Fig. 5.
Inverse relationship between angiogenesis and invasion. (a) SPARC immunostaining (brown) at the tumor periphery in first- and high-generation tumors. (b) Invasion of tumor cells in a collagen gel from first- and high-generation glioma spheroids. (c and d) Hif-1α and VEGF expression (brown), respectively, in first- and high-generation tumors. (e) Aortic ring explants incubated with conditioned medium from first- and high-generation tumor spheroids. Pictures from aortic ring and collagen-invasion assays were all taken on day 5. (Scale bars: 100 μm.)

References

    1. Eisterer W, Jiang X, Bachelot T, Pawliuk R, Abramovich C, Leboulch P, Hogge D, Eaves C. Mol Ther. 2002;5:352–359. - PubMed
    1. Garber K. Nat Biotechnol. 2002;20:1067–1068. - PubMed
    1. Brem S, Grossman SA, Carson KA, New P, Phuphanich S, Alavi JB, Mikkelsen T, Fisher JD. Neuro-oncol. 2005;7:246–253. - PMC - PubMed
    1. Akella NS, Twieg DB, Mikkelsen T, Hochberg FH, Grossman S, Cloud GA, Nabors LB. J Magn Reson Imaging. 2004;20:913–922. - PubMed
    1. Gagner JP, Law M, Fischer I, Newcomb EW, Zagzag D. Brain Pathol. 2005;15:342–363. - PMC - PubMed

Publication types