

Homeologous recombination in Solanum lycopersicoides introgression lines of cultivated tomato
- PMID: 17057228
- PMCID: PMC1698654
- DOI: 10.1534/genetics.106.065144
Homeologous recombination in Solanum lycopersicoides introgression lines of cultivated tomato
Abstract
A library of "introgression lines" containing Solanum lycopersicoides chromosome segments in the genetic background of cultivated tomato (Lycopersicon esculentum) was used to study factors affecting homeologous recombination. Recombination rates were estimated in progeny of 43 heterozygous introgressions and whole-chromosome substitution lines, together representing 11 of the 12 tomato chromosomes. Recombination within homeologous segments was reduced to as little as 0-10% of expected frequencies. Relative recombination rates were positively correlated with the length of introgressed segments on the tomato map. The highest recombination (up to 40-50% of normal) was observed in long introgressions or substitution lines. Double-introgression lines containing two homeologous segments on opposite chromosome arms were synthesized to increase their combined length. Recombination was higher in the double than in the single segment lines, despite a preference for crossovers in the region of homology between segments. A greater increase in homeologous recombination was obtained by crossing the S. lycopersicoides introgression lines to L. pennellii--a phylogenetically intermediate species--or to L. esculentum lines containing single L. pennellii segments on the same chromosome. Recombination rates were highest in regions of overlap between S. lycopersicoides and L. pennellii segments. The potential application of these results to breeding with introgression lines is discussed.
Figures
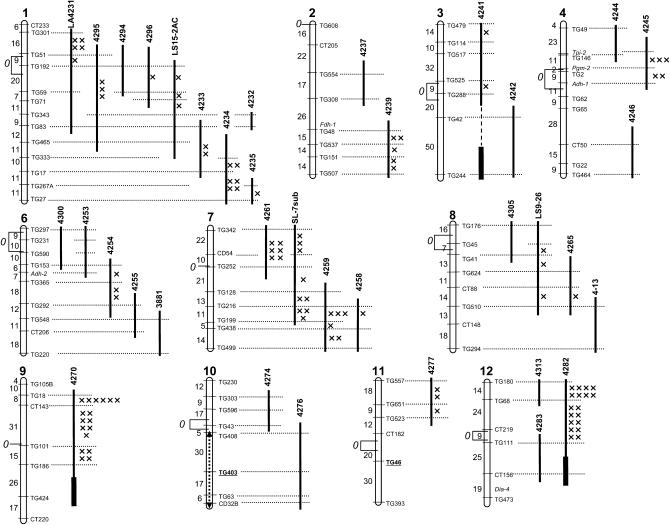
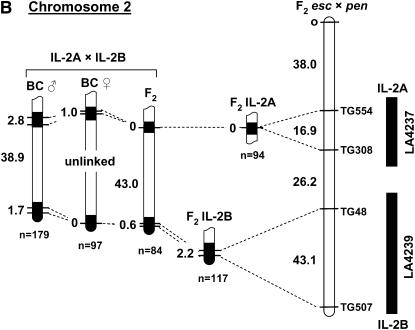
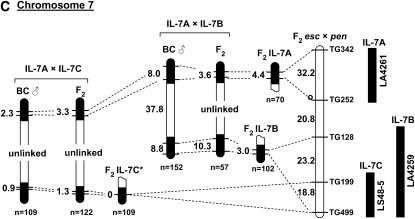
 's. (An absence of 's in a given interval indicates no crossovers were detected). Recombination data are summarized in Table 1. The distances between markers are from T
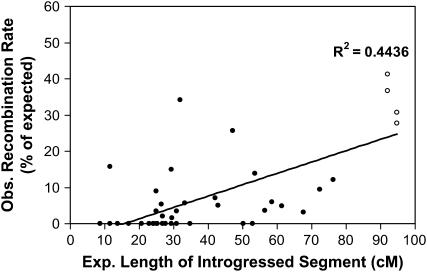
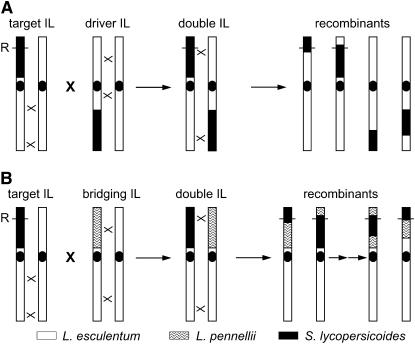
 . Representative recombinant chromosomes that are obtainable in the progeny are shown.
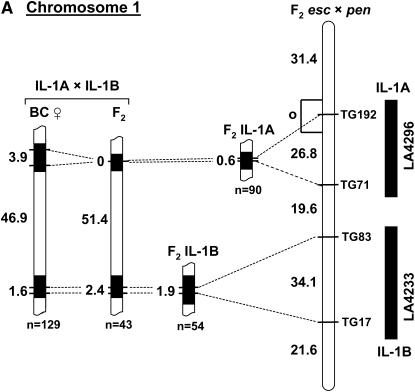
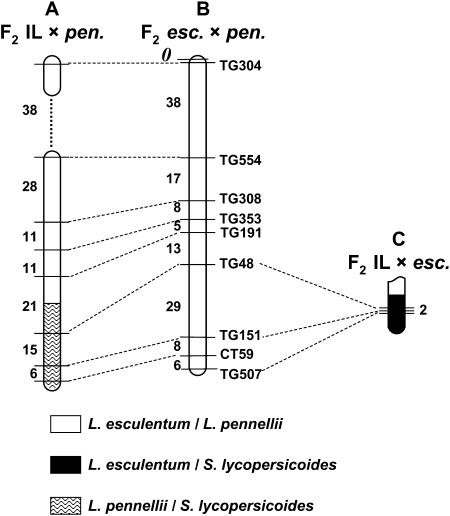
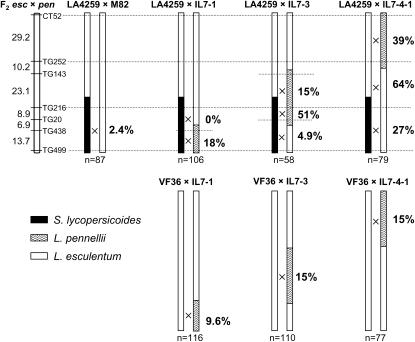
 indicates the region to which each recombination value applies. The positions of the L. pennellii segments are from L
References
-
- Canady, M. A., V. Meglic and R. T. Chetelat, 2005. A library of Solanum lycopersicoides introgression lines in cultivated tomato. Genome 48: 685–697. - PubMed
-
- Chetelat, R. T., and J. W. Deverna, 1991. Expression of unilateral incompatibility in pollen of Lycopersicon pennellii is determined by major loci on chromosomes 1, 6 and 10. Theor. Appl. Genet. 82: 704–712. - PubMed
Publication types
MeSH terms
Substances
LinkOut - more resources
Full Text Sources
Other Literature Sources
