. 2005:103:148-62; discussion 162-3.

Interactions between endothelia of the trabecular meshwork and of Schlemm's canal: a new insight into the regulation of aqueous outflow in the eye

Affiliations

Interactions between endothelia of the trabecular meshwork and of Schlemm's canal: a new insight into the regulation of aqueous outflow in the eye

Jorge A Alvarado et al. Trans Am Ophthalmol Soc. 2005.

Abstract

Purpose: To test the hypothesis that trabecular meshwork endothelial cells (TMEs) regulate aqueous outflow by actively releasing ligands that upon binding to Schlemm's canal endothelial cells (SCEs) increase transendothelial flow, thereby facilitating the egress of aqueous.

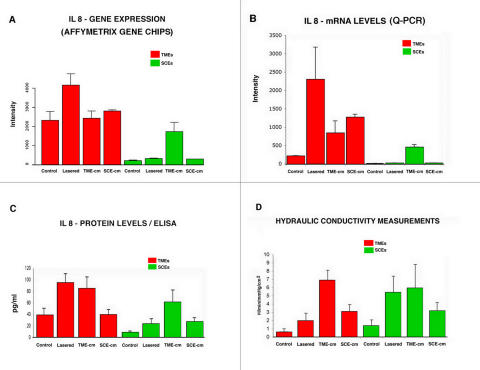
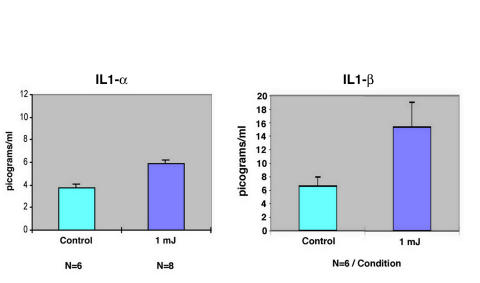
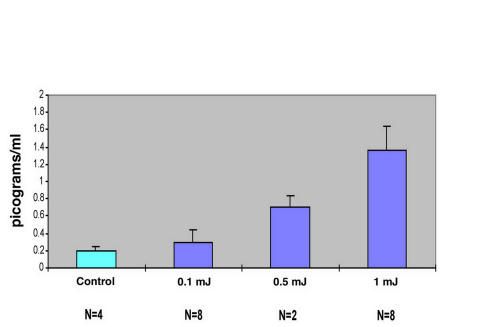
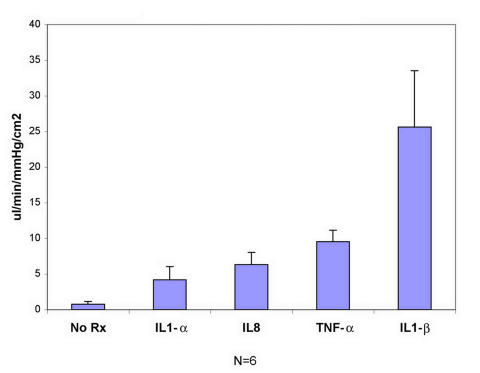
Methods: We tested our hypothesis by (1) activating the TMEs in vitro using a laser procedure known to increase aqueous outflow in vivo; (2) demonstrating that lasered TMEs become activated at the genome-wide level and synthesize ligands; (3) ascertaining that media conditioned by laser-activated TMEs and ligands therein increase transendothelial flow when added to SCEs; and (4) determining that ligands identified as synthesized by TMEs increase permeability when added to SCEs.

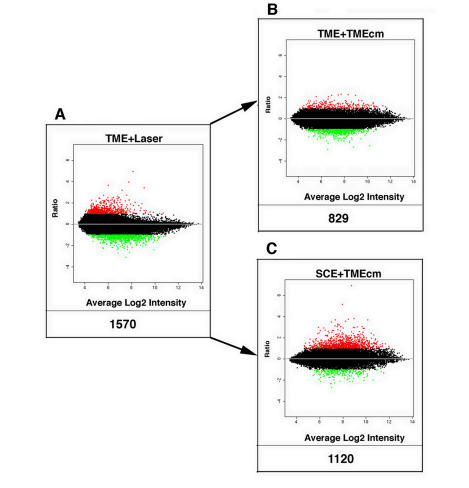
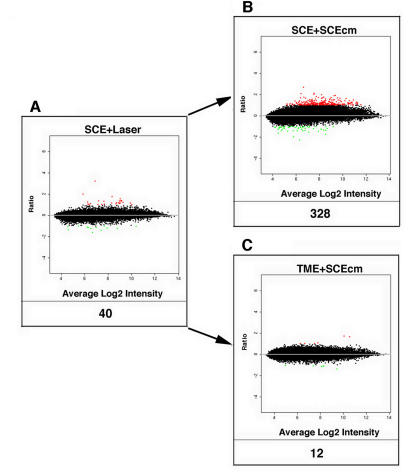
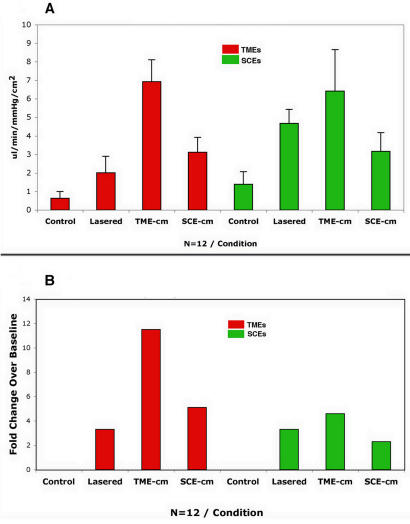
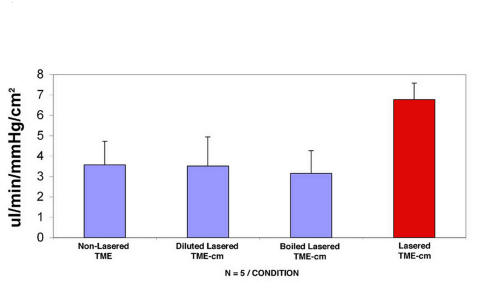
Results: We find that adding either media conditioned by lasered TMEs or ligands synthesized by TMEs to naïve control SCEs increases permeability. Adding media boiled, diluted, or conditioned by nonlasered TMEs abrogates these permeability effects. Media conditioned by either lasered TMEs or SCEs (TME-cm/SCE-cm), when added to untreated controls of each cell type, induce congruous gene expression and flow effects: TME-cm induces far more differentially expressed genes (829 in control TMEs and 1,120 in control SCEs) than does the SCE-cm (12 in control TMEs and 328 in control SCEs), and TME-cm also increases flow much more (more than 11-fold in control TMEs and more than fourfold in control SCEs) than does the SCE-cm (fivefold in control TMEs and twofold in control SCEs).

Conclusions: As postulated, the TMEs release factors that regulate SCE permeability. Derangement of this TME-driven process may play an important role in the pathogenesis of glaucoma. Ligands identified, which regulate permeability, have potential use for glaucoma therapy.


Figures

FIGURE 1
FIGURE 1
Gene expression in trabecular meshwork endothelial cells (TMEs). Log-based 2 ratio-intensity scatterplot comparing the profile of genes expressed by TMEs treated by the application of short-pulse green light delivered by a frequency-doubled Nd:YAG laser instrument (A) and by the addition of media conditioned by the lasered TMEs when added to naïve TMEs (B) or to naïve SCEs (C). Each dot represents the mean intensity log-ratio (base 2) versus the average log-intensity of a single gene based on four replicas (ie, one chip for each of four samples), with each replicate containing 11 probes per gene, using approximately 47,000 transcripts from 38,500 well-characterized genes. Red and green dots indicate up- and down-regulated genes demonstrating a twofold or greater differentially expressed (DE) ratio; the total number of DE genes for each category is indicated below each graph.
FIGURE 2
FIGURE 2
Gene expression in Schlemm’s canal endothelial cells (SCEs). Log-based 2 ratio-intensity scatterplot showing profiles of differentially expressed DE-genes in SCEs after the lasering procedure (A) and by the addition of SCE-cm to naïve SCEs (B) or to naïve trabecular meshwork endothelial cells (TMEs) (C).
FIGURE 3
FIGURE 3
Conductivity responses measured in μL/min/mm Hg/cm2. Bars represent the mean and the standard deviation in panel A for monolayers of trabecular meshwork endothelial cells (TMEs) and Schlemm’s canal endothelial cells (SCEs) in both controls and treated preparations as indicated. In panel B the treatment responses are depicted, adjusting for differences in baseline as a “-fold” change. Note that in all cases, the responses are robust, amounting to increases of over 11-fold in the case of the TME-cm, the highest response, and 200% in the case of naïve SCEs treated with SCE-cm, the smallest response.
FIGURE 4
FIGURE 4
Conductivity responses in preparations exposed to inactivated media compared with intact medium. Conductivity responses measured in μL/min/mm Hg/cm2 showing the mean and standard deviation in controls (blue bars) and in trabecular meshwork endothelial cells (TMEs) treated by the addition of media conditioned by laser-activated TMEs (red bar). Adding media from naïve TMEs, or from laser-activated TMEs that had been inactivated by dilution or boiling, effectively abrogated the increase in conductivity as observed when media conditioned by lasered TMEs was added (red bar).
FIGURE 5
FIGURE 5
Correlation of cDNA, mRNA, and cytokine expression with conductivity. Intensity plot depicting the responses measured (mean and standard deviation) in the eight experimental and control preparations. mRNA level using Affymetrix gene chips (A), quantitative polymerase chain reaction (PCR) measured using quantitative PCR (Q-PCR) (B), at the protein level measured using enzyme-linked immunosorbent assay (ELISA) (C). These responses are correlated with those measured in conductivity assays (D). The mRNA responses are measured as the mean intensity log-ratio (base 2). The ELISA measurements are expressed in picograms/mL, and the conductivity studies units in μL/min/mm Hg/cm2.
FIGURE 6
FIGURE 6
Induction of two cytokines by laser-activated trabecular meshwork endothelial cells (TMEs). Plot of the responses elicited by delivering 25 shots of 1 mJ in energy per sample in treated (n = 8) and control (n = 6) TME preparations expressed in picograms/mL. Mean and standard deviation plotted.
FIGURE 7
FIGURE 7
Laser energy versus tumor necrosis factor-α (TNF-α) release in trabecular meshwork endothelial cells: a dose-response effect. A dose-response effect is shown for the release of TNF-α as a function of the application of a standard number of laser shots of increasing energy as indicated. There is nearly an eightfold increase in the picograms/mL measured when using laser shots of 1 mJ in energy compared with untreated controls. Mean and standard deviation plotted.
FIGURE 8
FIGURE 8
Schlemm’s canal endothelial cells (SCEs) conductivity responses after the addition of indicated cytokines. Plot showing changes in conductivity induced by the direct addition to SCE monolayers of 10 ng of IL-1α, 5 ng of IL-8, 15 ng of tumor necrosis factor-α (TNF-α), and10 ng of IL-1β. Mean and standard deviation are shown.

References

    1. Hogan M, Alvarado J, Weddell J. Histology of the Human Eye: An Atlas and Textbook. Philadelphia: WB Saunders; 1971.
    1. Alvarado JA, Betanzos A, Franse-Carman L, et al. Endothelia of Schlemm’s canal and trabecular meshwork: distinct molecular, functional, and anatomic features. Am J Physiol Cell Physiol. 2004;286:C621–634. - PubMed
    1. Epstein DL, Rohen JW. Morphology of the trabecular meshwork and inner-wall endothelium after cationized ferritin perfusion in the monkey eye. Invest Ophthalmol Vis Sci. 1991;32:160–171. - PubMed
    1. Bylsma SS, Samples JR, Acott TS, et al. Trabecular cell division after argon laser trabeculoplasty. Arch Ophthalmol. 1988;106:544–547. - PubMed
    1. Alexander JP, Acott TS. Involvement of the Erk-MAP kinase pathway in TNFalpha regulation of trabecular matrix metalloproteinases and TIMPs. Invest Ophthalmol Vis Sci. 2003;44:164–169. - PubMed

Publication types

MeSH terms