. 2007 Apr;22(2):211-22.
doi: 10.1007/s10827-006-0008-4.

Low dose of dopamine may stimulate prolactin secretion by increasing fast potassium currents

Affiliations

Low dose of dopamine may stimulate prolactin secretion by increasing fast potassium currents

Joël Tabak et al. J Comput Neurosci. 2007 Apr.

Abstract

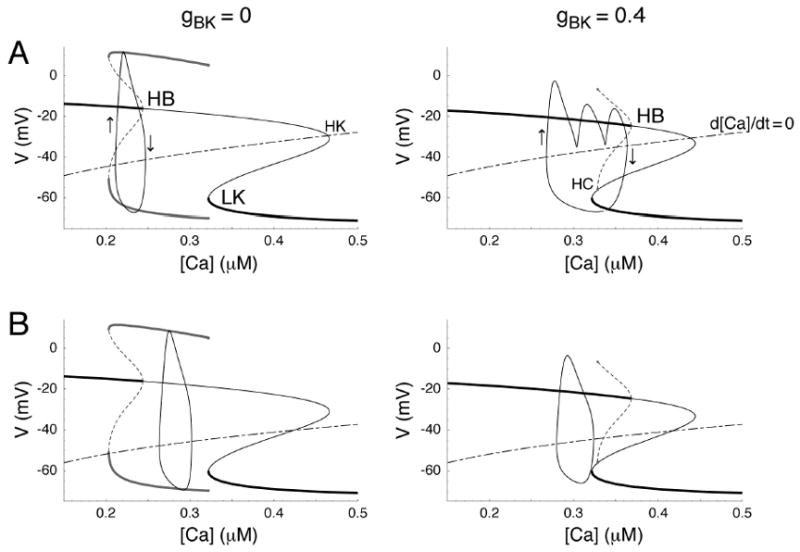
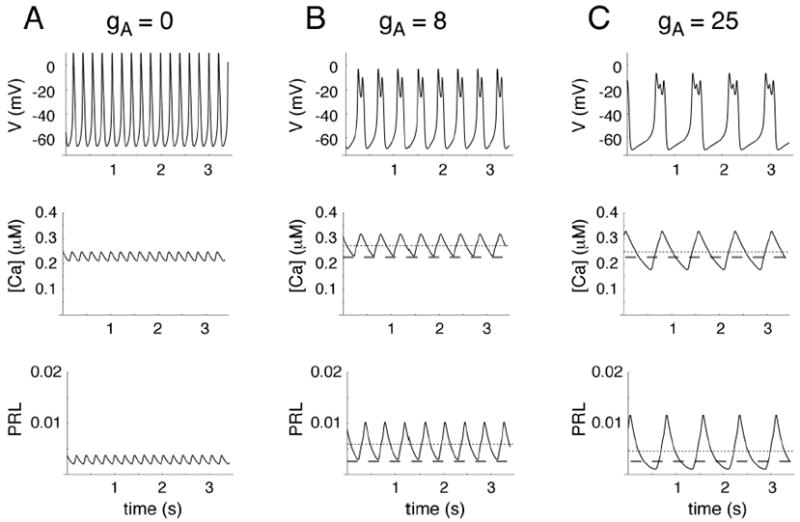
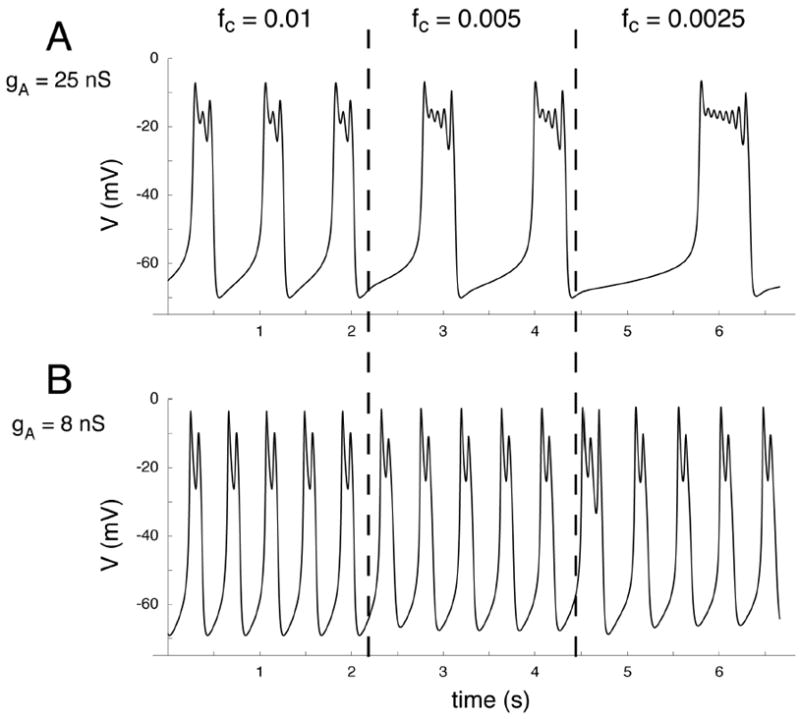
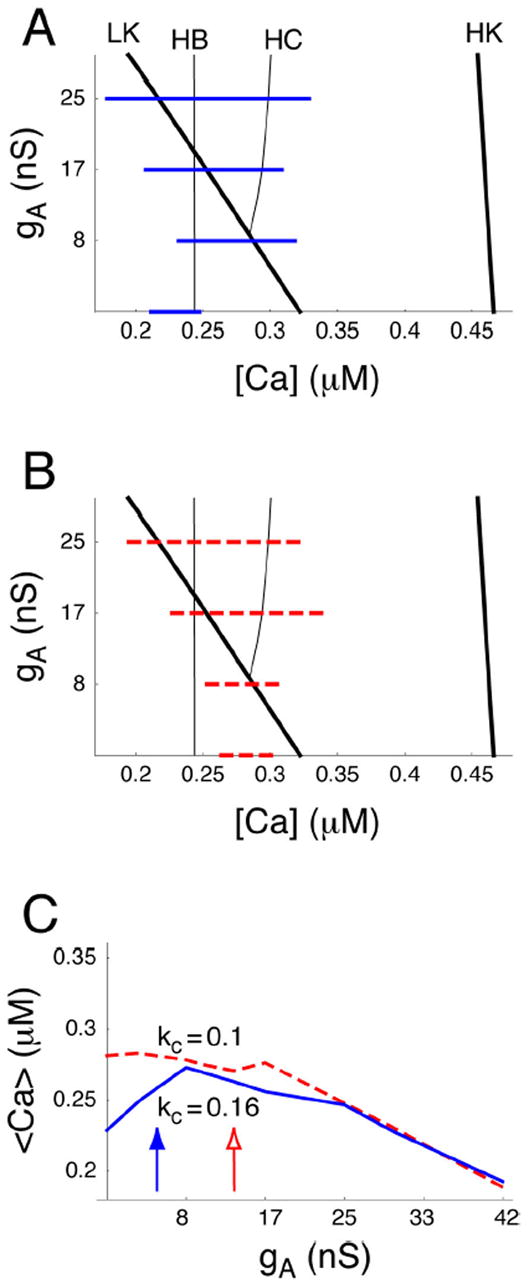
Dopamine (DA) released from the hypothalamus tonically inhibits pituitary lactotrophs. DA (at micromolar concentration) opens potassium channels, hyperpolarizing the lactotrophs and thus preventing the calcium influx that triggers prolactin hormone release. Surprisingly, at concentrations approximately 1000 lower, DA can stimulate prolactin secretion. Here, we investigated whether an increase in a K+ current could mediate this stimulatory effect. We considered the fast K+ currents flowing through large-conductance BK channels and through A-type channels. We developed a minimal lactotroph model to investigate the effects of these two currents. Both IBK and IA could transform the electrical pattern of activity from spiking to bursting, but through distinct mechanisms. IBK always increased the intracellular Ca2+ concentration, while IA could either increase or decrease it. Thus, the stimulatory effects of DA could be mediated by a fast K+ conductance which converts tonically spiking cells to bursters. In addition, the study illustrates that


Figures

Figure 1
Figure 1
Activation and inactivation functions of the voltage-dependent K+ currents. Thick black curve: activation of IK (n). Thin curve: activation of IBK (f). Dashed curves: activation and inactivation of IA (a, h). Both IBK and IA turn on at lower voltages than IK.
Figure 2
Figure 2
Effect of IBK on spike pattern, intracellular Ca2+ concentration and PRL release. For gBK=0 (A), the lactotroph model is spiking, [Ca] and PRL levels are above 0. Adding a small amount of BK conductance (B, gBK=0.2 nS) does not change the spike pattern but moderately increases [Ca] and PRL levels. These levels increase more significantly when the pattern switches to bursting (C, gBK=0.4 nS). In B and C, dotted lines represent the mean value, dashed lines represent mean value for gBK=0.
Figure 3
Figure 3
Effects of IBK on the fast subsystem bifurcation diagrams and the full system trajectory. A, kc=0.16 ms−1. Increasing gBK moves the periodic branch to the right and initiates bursting. Arrows indicate direction of motion. B, kc=0.1 ms−1. The bifurcation diagrams are identical to A, but increasing gBK does not lead to bursting and the trajectory moves only slightly to the right. In all panels, the z-shaped curve indicate the steady state of the system with [Ca] frozen (thick: stable; thin: unstable) and the ε-shaped curve indicate the minimum and maximum of periodic orbits (solid: stable; dashed: unstable). The dot-dashed curve is the [Ca]-nullcline. Above this curve d[Ca]/dt > 0 and below the curve d[Ca]/dt < 0. LK, low knee; HK, high knee; HB, Hopf bifurcation; HC, homoclinic bifurcation.
Figure 4
Figure 4
Summary of the effects of IBK on the lactotroph model. A, two-parameter bifurcation diagram. The diagram shows how the position of LK, HK, HB and HC (cf. Figure 3) vary with gBK. The main feature is that HB and HC move to the right when gBK is increased, creating a region of bistability for gBK > 0.2 nS. Horizontal bars represent the [Ca] variations during spiking or bursting of the model for various gBK and kc=0.16. B, when kc is reduced to 0.1 ms−1 bursting occurs at a higher value of gBK. C, Effect of gBK on the mean [Ca] for both values of kc. Arrows indicate the onset of bursting (closed, blue: kc=0.16; open, red: kc=0.1 ms−1).
Figure 5
Figure 5
Effect of IA on spike pattern, intracellular Ca2+ concentration and PRL release. A, gA=0, same as Figure 2A, showing the spiking regime and basal [Ca] and PRL levels. B, adding a small amount of A-type conductance (gA = 8 nS) initiates bursting and increases [Ca] and PRL levels. C, a higher conductance (gA = 25 nS) further increases burst duration but average [Ca] and PRL begin to decrease. In B and C, dotted lines represent the mean value, dashed lines represent mean value for gA=0.
Figure 6
Figure 6
Effects of IA on the fast subsystem bifurcation diagrams and the full system trajectory. A, kc=0.16 ms−1. Increasing gA moves the low knee to the left, i.e. towards higher [Ca]. Left panel, spiking trajectory, same as Fig 3A left. Middle panel, a bursting trajectory exists despite the lack of a bistability region between lower and upper branches. Most of the spiking branch is unstable. However, stable bursting and chaotic solutions coexist with the unstable periodic branch (not shown). Right panel, the bursting trajectory encompasses (and slightly overshoots) the bistability region. B, kc=0.1 ms−1. The bifurcation diagrams are identical to A, but the trajectories are restricted to narrower [Ca] ranges in the middle and right panels.
Figure 7
Figure 7
Effect of increasing the [Ca] time constant on the bursting pattern. A, gA = 25 nS, decreasing fc slows down the bursts as expected for “classical” bursting. B, gA = 8 nS, decreasing fc has practically no effect on the burst pattern. The vertical dashed lines indicate the time when fc was changed.
Figure 8
Figure 8
Summary of the effects of IA on the lactotroph model. A, two-parameter bifurcation diagram. As gA is increased, the LK is moved to the left, creating a region of bistability for gA > 9 nS. Horizontal bars represent the [Ca] variations during spiking or bursting for various gA and kc=0.16. B, same for kc=0.1 ms−1. C, Average [Ca] over a range of values of gA. Arrows indicate the onset of bursting (closed, blue: kc=0.16; open, red: kc=0.1 ms−1). For kc=0.16 <Ca> first increases with gA and then decreases as a bistability range is created and the trajectory extends to lower [Ca] values.

References

    1. Arey BJ, Burris TP, Basco P, Freeman ME. Infusion of Dopamine at Low Concentrations Stimulates the Release of Prolactin from Alpha-Methyl-P-Tyrosine-Treated Rats. Proceedings of the Society for Experimental Biology and Medicine. 1993;203:60–63. - PubMed
    1. Ben Jonathan N, Hnasko R. Dopamine as a prolactin (PRL) inhibitor. Endocrine Reviews. 2001;22:724–763. - PubMed
    1. Bertram R, Butte MJ, Kiemel T, Sherman A. Topological and Phenomenological Classification of Bursting Oscillations. Bulletin of Mathematical Biology. 1995;57:413–439. - PubMed
    1. Burris TP, Freeman ME. Low Concentrations of Dopamine Increase Cytosolic Calcium in Lactotrophs. Endocrinology. 1993;133:63–68. - PubMed
    1. Burris TP, Nguyen DN, Smith SG, Freeman ME. The Stimulatory and Inhibitory Effects of Dopamine on Prolactin Secretion Involve Different G-Proteins. Endocrinology. 1992;130:926–932. - PubMed

Publication types

MeSH terms