. 2006 Dec;56(6):1301-10.
doi: 10.1002/mrm.21075.

Cardiorespiratory-resolved magnetic resonance imaging: measuring respiratory modulation of cardiac function

Affiliations

Cardiorespiratory-resolved magnetic resonance imaging: measuring respiratory modulation of cardiac function

Richard B Thompson et al. Magn Reson Med. 2006 Dec.

Abstract

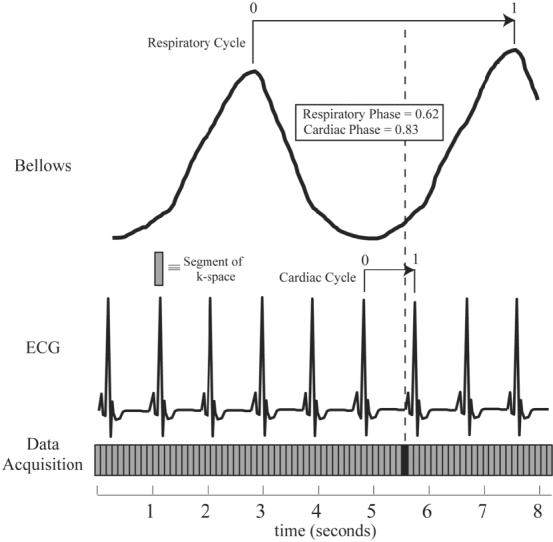
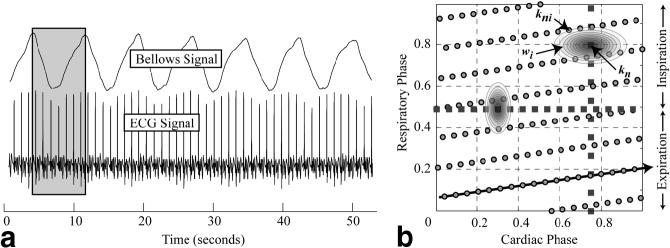
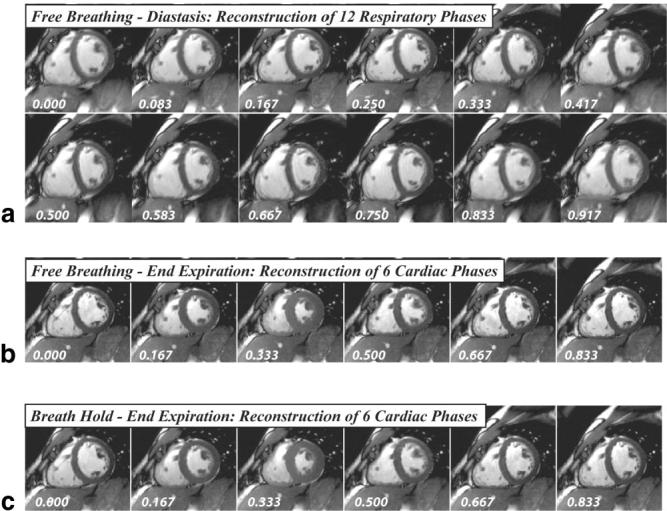
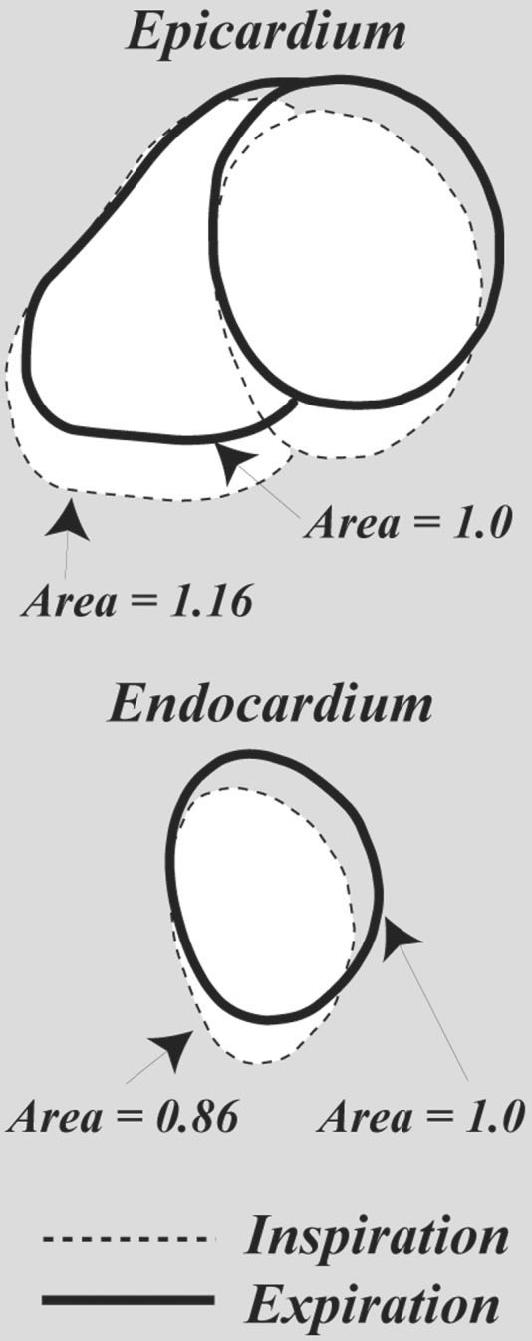
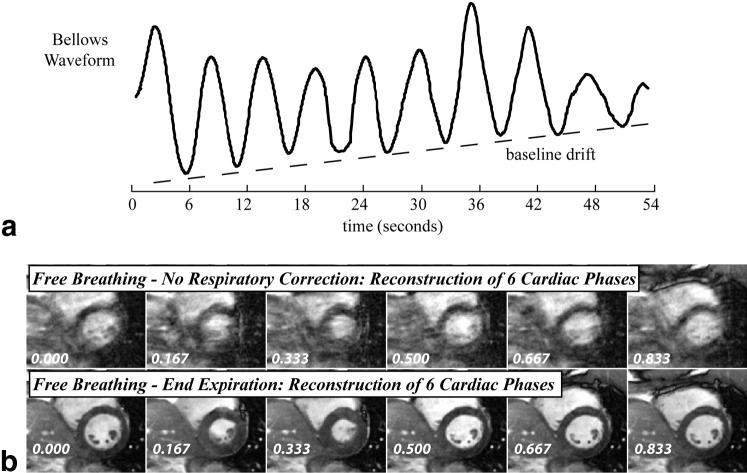
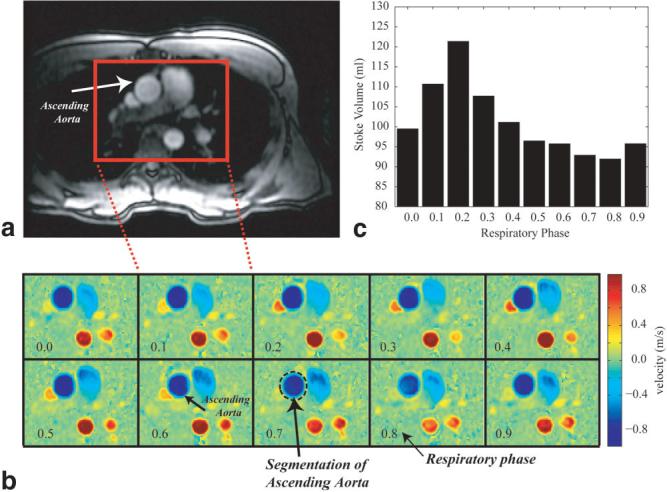
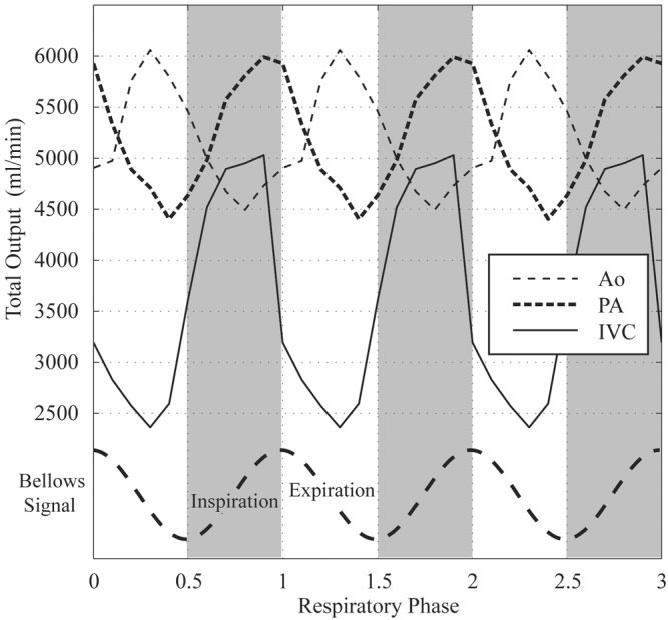
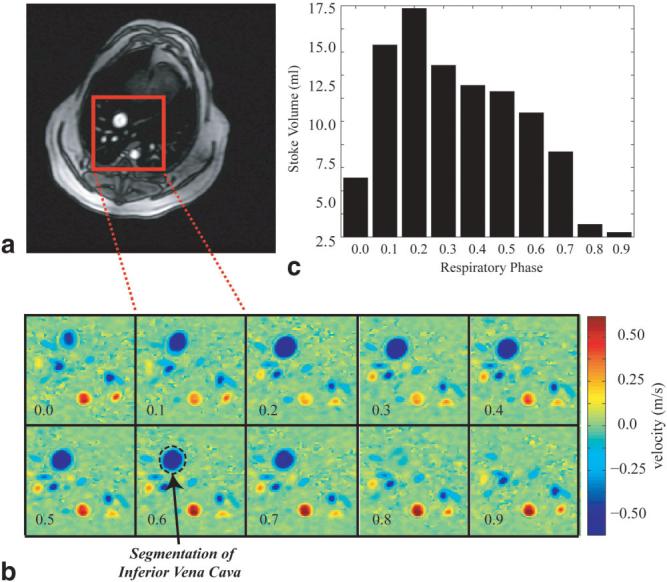
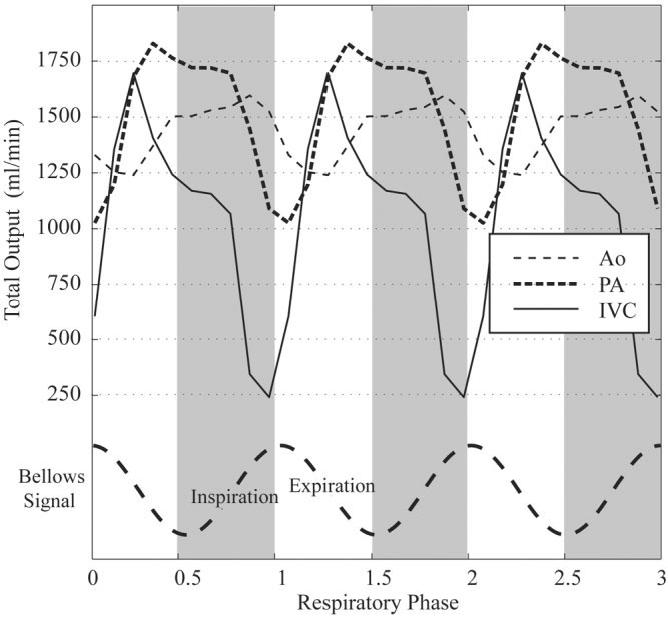
A technique for cardiac- and respiratory-resolved MRI is described. A retrospectively gated-segmented acquisition scheme similar to that used in conventional cine cardiac imaging was used to collect image data that spanned both the cardiac and respiratory cycles. Raw k-space data were regridded in a cardiorespiratory phase space to allow image reconstruction at target cardiac and respiratory phases. The approach can be applied with various k-space trajectories and pulse sequences, and was implemented in this study with both a Cartesian steady-state free precession (SSFP) sequence and a radial phase-contrast (PC) pulse sequence. Free-breathing short-axis SSFP images of the heart were reconstructed at multiple respiratory and cardiac phases to illustrate separation of cardiac and respiratory motion without artifacts. A respiratory-resolved radial PC experiment was used to quantify the volumetric flow rates in the inferior vena cava (IVC), pulmonary artery (PA), and aorta (Ao) in five free-breathing normal volunteers and a positive-pressure ventilated dog. Total flow (ml/min) in each vessel was quantified as a function of respiratory phase (peak/minimum output = 1.85 +/- 0.29 (IVC), 1.36 +/- 0.15 (PA), 1.24 +/- 0.09 (Ao)). Peak flow occurred during inspiration for the IVC and PA, and during expiration for the Ao, and there was a complete pattern reversal for the positive-pressure ventilated dog.


Figures

FIG. 1
FIG. 1
Retrospectively gated-segmented data acquisition scheme for imaging with resolution of both cardiac and respiratory phase information. Each segment of k-space (indicated by the shaded rectangle) is acquired for at least a complete respiratory cycle and several cardiac cycles. Respiratory and cardiac phases (numbered from 0 to 1) are assigned to each k-space segment based on the measured ECG and respiratory bellows signals.
FIG. 2
FIG. 2
Sample ECG and bellows signals from a volunteer and the filling of cardiorespiratory phase space. a: The gray insert indicates the duration of the repeated acquisition of a single segment of k-space over ∼7 s, spanning a complete breathing cycle and seven heartbeats. The cardiac and respiratory phases of each segment of k-space are shown as the circles in b. The squares in b show two reconstruction trajectories: the vertical line represents images with resolution of respiration with no cardiac motion, and the horizontal line represents a breath-hold-like series of cardiac-resolved images, with no respiratory effects. The ellipsoidal shapes, wi, on each dashed line illustrate the asymmetric kernels that are used for regridding. The labels kni and kn indicate the acquired k-space data and the resulting interpolated value, respectively.
FIG. 3
FIG. 3
a: A series of 12 short-axis SSFP images reconstructed from a free-breathing acquisition along the vertical line shown in b. The images are reconstructed at a static cardiac phase (0.75) and the full span of respiratory phases (from 0 to 1). b: Six breath-hold-like images reconstructed from the same free-breathing acquisition, along the horizontal line in b. c: The same six cardiac phases from a separate breath-hold acquisition for the same slice orientation.
FIG. 4
FIG. 4
Tracings of the epicardium and endocardium from short-axis SSFP images at respiratory phases of 0.25 and 0.75, from Fig. 3a. The LV inspiration-phase image (dashed line) has a relative cross-sectional area of 0.86 as compared to the expiratory image (solid line), while the same ratio for the RV yielded a ratio of 1.16.
FIG. 5
FIG. 5
a: A bellows waveform recorded from a volunteer with a noticeable drift in his breathing pattern. b: SSFP cine image data acquired during these breathing cycles were reconstructed without and with respiratory binning. Six cardiac phases out of 20 reconstructed images are shown. The phase of each image is shown in the figure.
FIG. 6
FIG. 6
a: Axial slice prescription for a free-breathing PC study in the ascending Ao of a normal volunteer. b: PC images for the rectangular region shown in the slice prescription image (a) at a single systolic phase and 10 respiratory phases. c: The stroke volume for each of the 10 respiratory phases shown in b, each of which was calculated by integrating the flow from all of 30 cardiac phases.
FIG. 7
FIG. 7
Variation in blood flow per minute in the IVC, PA, and Ao in a normal volunteer as a function of respiratory phase. Three cycles of breathing are displayed to provide a sense of the relationship among flow patterns in these three great vessels.
FIG. 8
FIG. 8
a: Axial slice prescription for a free-breathing PC study in the canine IVC. b: PC images for the rectangular region shown in the slice prescription image (a) at a single systolic phase and 10 respiratory phases. c: The stroke volume for each of the 10 respiratory phases shown in b, each of which was calculated by integrating the flow from all of 30 cardiac phases.
FIG. 9
FIG. 9
Variation in blood flow per minute in the canine IVC, PA, and Ao as a function of respiratory phase. Three cycles of breathing are displayed to provide a sense of the relationship among flow patterns in these three great vessels.

References

    1. Hatle LK, Appleton CP, Popp RL. Differentiation of constrictive pericarditis and restrictive cardiomyopathy by Doppler echocardiography. Circulation. 1989;79:357–370. - PubMed
    1. Sakuma H, Kawada N, Kubo H, Nishide Y, Takano K, Kato N, Takeda K. Effect of breath holding on blood flow measurement using fast velocity encoded cine MRI. Magn Reson Med. 2001;45:346–348. - PubMed
    1. Francone M, Dymarkowski S, Kalantzi M, Bogaert J. Real-time cine MRI of ventricular septal motion: a novel approach to assess ventricular coupling. J Magn Reson Imaging. 2005;21:305–309. - PubMed
    1. Francone M, Dymarkowski S, Kalantzi M, Rademakers FE, Bogaert J. Assessment of ventricular coupling with real-time cine MRI and its value to differentiate constrictive pericarditis from restrictive cardiomyopathy. Eur Radiol. 2005:1–8. - PubMed
    1. Thompson RB, McVeigh ER. Real-time volumetric flow measurements with complex-difference MRI. Magn Reson Med. 2003;50:1248–1255. - PMC - PubMed