. 2006 Oct 31;45(43):13054-63.
doi: 10.1021/bi060591r.

Multiple steps determine the overall rate of the reduction of 5alpha-dihydrotestosterone catalyzed by human type 3 3alpha-hydroxysteroid dehydrogenase: implications for the elimination of androgens

Affiliations

Multiple steps determine the overall rate of the reduction of 5alpha-dihydrotestosterone catalyzed by human type 3 3alpha-hydroxysteroid dehydrogenase: implications for the elimination of androgens

Yi Jin et al. Biochemistry. .

Abstract

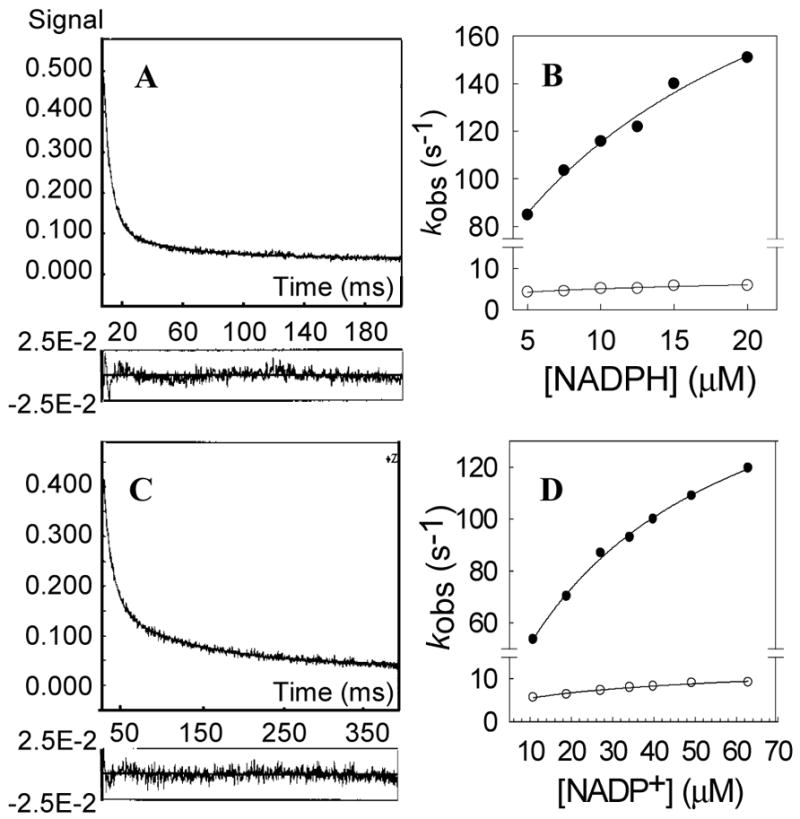
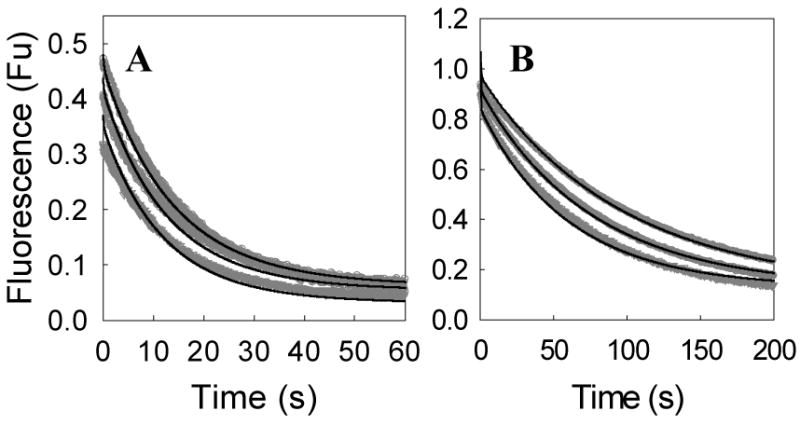
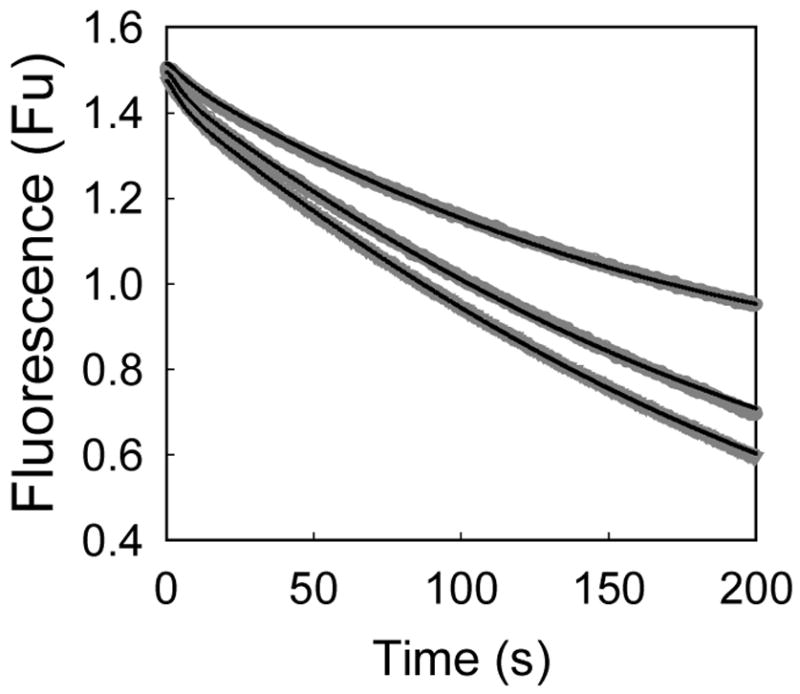
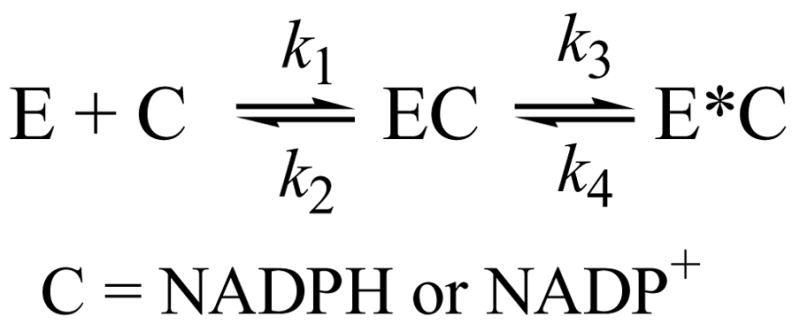
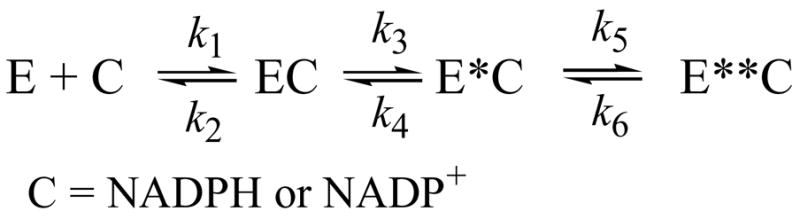
Human type 3 3alpha-hydroxysteroid dehydrogenase, or aldo-keto reductase (AKR) 1C2, eliminates the androgen signal in human prostate by reducing 5alpha-dihydrotestosterone (DHT, potent androgen) to form 3alpha-androstanediol (inactive androgen), thereby depriving the androgen receptor of its ligand. The k(cat) for the NADPH-dependent reduction of DHT catalyzed by AKR1C2 is 0.033 s(-1). We employed transient kinetics and kinetic isotope effects to dissect the contribution of discrete steps to this low k(cat) value. Stopped-flow experiments to measure the formation of the AKR1C2.NADP(H) binary complex indicated that two slow isomerization events occur to yield a tight complex. A small primary deuterium isotope effect on k(cat) (1.5) and a slightly larger effect on k(cat)/K(m) (2.1) were observed in the steady state. In the transient state, the maximum rate constant for the single turnover of DHT (k(trans)) was determined to be 0.11 s(-1) for the NADPH-dependent reaction, which was approximately 4-fold greater than the corresponding k(cat) x k(trans) was significantly reduced when NADPD was substituted for NADPH, resulting in an apparent (D)k(trans) of 3.5. Thus, the effects of isotopic substitution on the hydride transfer step were masked by slow events that follow or precede the chemical transformation. Transient multiple-turnover reactions generated curvilinear reaction traces, consistent with the product formation and release occurring at comparable rates. Global fitting analysis of the transient kinetic data enabled the estimate of the rate constants for the three-step cofactor binding/release model and for the minimal ordered bi-bi turnover mechanism. Results were consistent with a kinetic mechanism in which a series of slow events, including the chemical step (0.12 s(-1)), the release of the steroid product (0.081 s(-1)), and the release of the cofactor product (0.21 s(-1)), combine to yield the overall observed low turnover number.


Figures

Figure 1
Figure 1
Elimination of androgen signal by AKR1C2. AR= androgen receptor.
Figure 2
Figure 2
Representative kinetic traces for the binding of NADPH and NADP+ to AKR1C2. (A) The averaged progress curve for the quenching of protein fluorescence observed upon rapid mixing of the enzyme solution with the NADPH solution. The sample contained 0.5 μM AKR1C2 and 12.5 μM NADPH. Data were fitted to a double-exponential function (eq. 3), yielding A1 = 0.55 ± 0.004 (Fluorescence unit), k1 = 120 ± 1 (s−1), A2 = 0.16 ± 0.002 (Fluorescence unit), k2= 7.7 ± 0.2 (s−1). (B) Secondary plots of the observed rate constants versus [NADPH] fitted to a hyperbolic function. (C) The averaged progress curve for the quenching of protein fluorescence observed upon rapid mixing of the enzyme solution with the NADP+ solution. The sample contained 1 μM AKR1C2 and 18.8 μM NADP+. Data were fitted to a double-exponential function (eq. 3), yielding A1 = 0.25 ± 0.002 (Fluorescence unit), k1 = 90 ± 1 (s−1), A2 = 0.11 ± 0.001 (Fluorescence unit), k2= 6.3 ± 0.2 (s−1). (D) Secondary plots of the observed rate constants kobs1 (●) and kobs2 (○) versus [NADP+] fitted to hyperbolic function.
Figure 3
Figure 3
Global simulation of progress curves for the binding of (A) NADPH and (B) NADP+ to AKR1C2. Experimental (gray) and simulated (black) progress curves of protein fluorescence at 330 nm are shown. The samples contained 0.5 μM AKR1C2 and 5.0, 7.5, and 12.5 μM of NADPH (top to bottom in A) or 1 μM AKR1C2 and 10.8, 18.8, and 27.1 μM of NADP+ (top to bottom in B) (all final concentrations). For clarity, data for other concentrations of cofactors were not shown, but were used in the global fitting. Simulated lines used microscopic rate constants from Table 1, fitted to the 3-step binding mechanism in Scheme 3.
Figure 4
Figure 4
Representative kinetic traces for the single turnover of DHT catalyzed by AKR1C2 using either NADPH or NADPD as cofactor. (A) The averaged progress curves for the reaction of the premixed enzyme-cofactor solution with DHT solution. The samples contained 0.45 μM AKR1C2, 0.4 μM NADPH (bottom trace) or 0.4 μM NADPD (top trace), and 10 μM DHT. Data were fitted to the single-exponential function (eq. 3). (B) Secondary plots of the apparent first-order rate constants kobs for NADPH (□) or NADPD (○) versus [DHT], fitted to hyperbolic functions (eq. 5).
Figure 5
Figure 5
Global simulation of progress curves for NADPH (A) and NADPD (B) dependent single turnover of DHT catalyzed by AKR1C2. Experimental (gray) and simulated (black) progress curves of decrease in NADPH fluorescence at 450 nm are shown. The samples contained 0.45 μM AKR1C2, 0.4 μM of NADPH or NADPD, and 5, 15, and 20 μM of DHT (traces top to bottom). For clarity, data for other concentrations of DHT were not shown, but were used in the global fitting. The simulated lines used rate constants from Table 2, fitted to the mechanism of Scheme 4.
Figure 6
Figure 6
Representative kinetic traces for the multiple turnover of DHT catalyzed by AKR1C2 in the transient state. (A) The averaged progress curve of NADPH fluorescence at 450 nm for the sample containing 0.85 μM AKR1C2, 10 μM NADPH, and 20 μM DHT. The trace was fitted to the burst equation (eq. 7), yielding the burst amplitude A1 = 0.11 (Fluorescence unit), corresponds to 0.25 enzyme equivalents, kobs1 = 0.079 (s−1), and kobs2= 0.014 (μM s−1). (B) and (C) Secondary plots of the observed rate constants kobs1 and kobs2 versus [DHT], fitted to a hyperbolic equation to yield kburst and kss.
Figure 7
Figure 7
Global simulation of progress curves for multiple turnover of DHT catalyzed by AKR1C2 in the transient state. Experimental (gray) and simulated (black) progress curves of NADPH fluorescence at 450 nm are shown. The samples contained 0.85 μM AKR1C2, 10 μM of NADPH, and 10, 15, and 20 μM of DHT (traces top to bottom). For clarity, data for other concentrations of DHT were not shown, but were used in the global fitting. The simulated lines used rate constants from Table 2, fitted to the mechanism of Scheme 1.
Scheme 1
Scheme 1
Scheme 2
Scheme 2
Scheme 3
Scheme 3
Scheme 4
Scheme 4

Similar articles

Cited by

References

    1. Penning TM, Jin Y, Steckelbroeck S, Rizner TL, Lewis M. Structure-function of human 3α-hydroxysteroid dehydrogenases: genes and proteins. Mol Cell Endocrinol. 2004;215:63–72. - PubMed
    1. Jez JM, Flynn TG, Penning TM. A new nomenclature for the aldo-keto reductase superfamily. Biochem Pharmacol. 1997;54:639–647. - PubMed
    1. Hyndman D, Bauman DR, Heredia VV, Penning TM. The aldo-keto reductase superfamily homepage. Chem Biol Interact. 2003;143-144:621–631. - PubMed
    1. Penning TM. Molecular endocrinology of hydroxysteroid dehydrogenases. Endocrine Reviews. 1997;18:281–305. - PubMed
    1. Penning TM. Hydroxysteroid dehydrogenases and pre-receptor regulation of steroid hormone action. Hum Reprod Update. 2003;9:193–205. - PubMed

Publication types