. 2007 Mar 1;402(2):279-90.
doi: 10.1042/BJ20060793.

Insulin-stimulated exocytosis of GLUT4 is enhanced by IRAP and its partner tankyrase

Affiliations

Insulin-stimulated exocytosis of GLUT4 is enhanced by IRAP and its partner tankyrase

Tsung-Yin J Yeh et al. Biochem J. .

Abstract

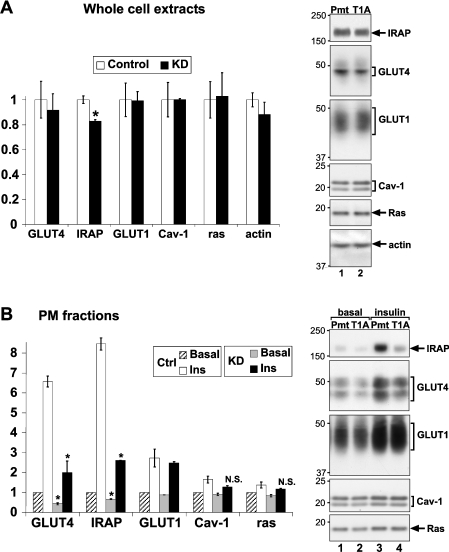
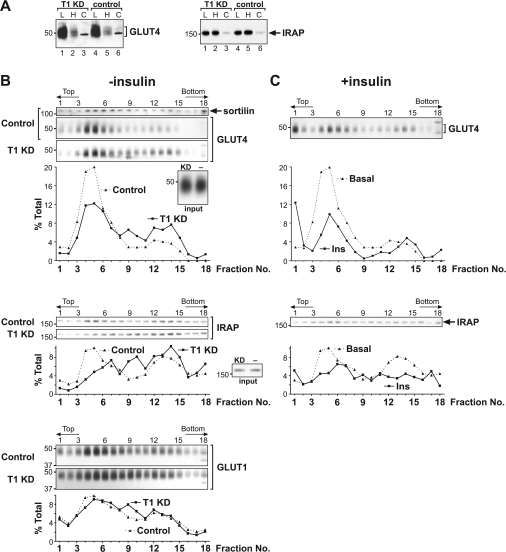
The glucose transporter GLUT4 and the aminopeptidase IRAP (insulin-responsive aminopeptidase) are the major cargo proteins of GSVs (GLUT4 storage vesicles) in adipocytes and myocytes. In the basal state, most GSVs are sequestered in perinuclear and other cytosolic compartments. Following insulin stimulation, GSVs undergo exocytic translocation to insert GLUT4 and IRAP into the plasma membrane. The mechanisms regulating GSV trafficking are not fully defined. In the present study, using 3T3-L1 adipocytes transfected with siRNAs (small interfering RNAs), we show that insulin-stimulated IRAP translocation remained intact despite substantial GLUT4 knockdown. By contrast, insulin-stimulated GLUT4 translocation was impaired upon IRAP knockdown, indicating that IRAP plays a role in GSV trafficking. We also show that knockdown of tankyrase, a Golgi-associated IRAP-binding protein that co-localizes with perinuclear GSVs, attenuated insulin-stimulated GSV translocation and glucose uptake without disrupting insulin-induced phosphorylation cascades. Moreover, iodixanol density gradient analyses revealed that tankyrase knockdown altered the basal-state partitioning of GLUT4 and IRAP within endosomal compartments, apparently by shifting both proteins toward less buoyant compartments. Importantly, the afore-mentioned effects of tankyrase knockdown were reproduced by treating adipocytes with PJ34, a general PARP (poly-ADP-ribose polymerase) inhibitor that abrogated tankyrase-mediated protein modification known as poly-ADP-ribosylation. Collectively, these findings suggest that physiological GSV trafficking depends in part on the presence of IRAP in these vesicles, and that this process is regulated by tankyrase and probably its PARP activity.


Figures

Figure 1
Figure 1. GLUT4 knockdown does not impair IRAP translocation
3T3-L1 adipocytes were electroporated on day 6 of differentiation with either a GLUT4 siRNA (G4A or G4B), a scrambled siRNA (Scr) or buffer alone (buf). Cells were insulin-stimulated as indicated (20 nM for 20 min) on day 8 prior to analysis. (A) Whole-cell extracts were immunoblotted (right-hand panel, 30 μg protein/lane) for the indicated proteins. The bar graph to the left shows densitometry quantification (means±S.E.M.) of the knockdown samples (mean of lanes 2, 4 and 6) normalized against the control (mean of lanes 1, 3 and 5). (B) [3H]Deoxy-D-glucose uptake in the basal state and after insulin stimulation was normalized against the protein content and shown in arbitrary units (a.u.). Each data point represents the means±S.E.M. of four replicates. (C) The PM fractions were immunoblotted for the indicated proteins (right-hand panel, 15 μg protein/lane), quantified by densitometry, and normalized against the unstimulated control (lane 3). The bar graph to the left shows the mean of insulin-stimulated knockdowns (lanes 2 and 6) and the mean of insulin-stimulated controls (lanes 1 and 5). *P<0.05 from the control; N.S., not significantly different. Each panel was repeated once (A and C) or twice (B) with similar results. Ctrl, control; KD, knockdown.
Figure 2
Figure 2. IRAP knockdown attenuates insulin-stimulated translocation of GLUT4 and GLUT1
(A) Adipocytes were electroporated on day 6 with buffer alone (Buff), vp-A, vp-B or a scrambled control (Scr) (lanes 1–4 respectively). Whole-cell extracts (30 μg of protein) on day 8 were immunoblotted for IRAP and GLUT4 (upper panels). The bar graph shows basal and insulin-stimulated glucose uptake determined as in Figure 1(B). The experiment was repeated three times with similar results. (B) Whole-cell extracts of adipocytes electroporated with a scrambled siRNA (Scr, lane 1) or vp-A (lane 2) were immunoblotted (30 μg protein/lane) for the indicated proteins, quantified by densitometry and normalized to lane 1. The bar graph shows the means±S.E.M. of triplicates. *P<0.05. (C) Adipocytes electroporated with a scrambled siRNA (Scr, lanes 1 and 3) or vp-A (lanes 2 and 4) were stimulated with insulin (20 nM for 20 min) as indicated. The PM fractions (15 μg protein/lane) were immunoblotted for the indicated proteins. The bar graph shows the means±S.E.M. of two sets of independent experiments, each normalized to lane 1 prior to being pooled for analysis. (D) Membrane fractions of adipocytes prepared as described in the Materials and methods section were immunoblotted for IRAP and TfR (2.5, 1.5 and 1 μl in lanes 3–5 respectively), and 300 μl aliquots were immunoprecipitated (IP) using GLUT1 antiserum (lanes 1 and 6) or control immunoglobulin (lanes 2 and 7). The supernatants were immunoblotted for GLUT1 and tubulin (30 μl, lanes 1 and 2), whereas the precipitates were eluted with 300 μl of 2% C12E8 and immunoblotted for IRAP and TfR (20 μl eluate/lane). The results shown are representative of four independent experiments performed at slightly varied stoichiometry. (E) Adipocytes electroporated with vp-A (lanes 1 and 2) or a scrambled siRNA (Scr, lanes 3 and 4) were stimulated with insulin (20 nM for 20 min) as indicated. Whole-cell extracts were immunoblotted using antibodies against AS160 (left-hand panel) or phospho-Akt substrates (right-hand panel). Ctrl, control; KD, knockdown.
Figure 3
Figure 3. Tankyrase knockdown impairs glucose uptake reversibly and dose-dependently
Adipocytes were electroporated on day 6 with a tankyrase siRNA (T1A or T1B), a point-mutation control (Pmt) or buffer alone (Buff). (A) Extracts prepared on day 8 (lanes 1–6) or day 9 (lanes 7–9) were immunoblotted for tankyrase (upper panels) and tankyrase-2 (lower panels). (B) [3H]Deoxy-D-glucose uptake in the basal state and after insulin stimulation (20 nM for 20 min) was determined on day 8 (left-hand panel) or day 9 (right-hand panel) as in Figure 1(B). The results shown are representative of four (day 8) or two (day 9) experiments. TNKS-1, tankyrase-1; TNKS-2, tankyrase-2.
Figure 4
Figure 4. Tankyrase knockdown impairs the translocation of IRAP and GLUT4 but not GLUT1
Day 6 adipocytes were electroporated with T1A siRNA or a point-mutation control (Pmt). On day 8, (A) whole-cell extracts (30 μg protein/lane) and (B) the PM fractions (15 μg protein/lane) were immunoblotted and quantified as described in Figure 2(C). The bar graph to the left shows the means±S.E.M. of two basal samples and of four insulin-stimulated samples. *P<0.05. This experiment was repeated twice with similar results.
Figure 5
Figure 5. Insulin-induced phosphorylation is preserved but hypertonicity-induced glucose uptake is impaired in tankyrase-depleted adipocytes
(A) Day 6 adipocytes were electroporated with T1A (lanes 3 and 4) or the point-mutation control Pmt (lanes 1 and 2). After insulin stimulation (20 nM for 30 min) as indicated (lanes 2 and 4) on day 8, extracts were immunoblotted for the IR, other signalling molecules as indicated, and their phosphorylated forms (30 μg protein/lane). (B) Adipocytes electroporated on day 6 with T1A (open bars) or the point-mutation control Pmt (solid bars) were assayed on day 8 for [3H]deoxy-D-glucose uptake in the basal state and after osmotic shock (600 mM sorbitol for 20 min). The average uptake of 6 wells (means±S.E.M.) is shown. This study was repeated once with similar results. ERK, extracellular-signal-regulated kinase.
Figure 6
Figure 6. Effect of tankyrase knockdown on intracellular GLUT4 and IRAP distribution
(A) PNSs of adipocytes electroporated on day 6 with T1A (lanes 1–3) or the point-mutation control pmt (lanes 4–6) and serum-starved on day 8 were subjected to differential centrifugation. From each 10 cm plate of adipocytes, 1% of the LDM (lanes 1 and 4), 5% of the HDM (lanes 2 and 5) and 1.5% of the cytosolic fraction (lanes 3 and 6) were loaded on to SDS gels for immunoblotting. The blots shown are representative of five independent experiments. (B) Day 6 adipocytes were electroporated with T1A (solid curves) or the control pmt (dotted curves) and harvested on day 8 after a 2 h serum starvation. PNS of controls and knockdowns were resolved in parallel in 14% self-forming iodixanol density gradients, and fractions were immunoblotted for the indicated proteins. The effect of the knockdown shown is representative of four batches of electroporated cells. The insets compare knockdowns (left-hand lane) with controls (right-hand lane) (20 μg of protein/lane) for the amount of GLUT4 and IRAP in the input PNS. (C) Adipocytes electroporated with the control siRNA pmt as in (B) were stimulated with 20 nM insulin for 20 min. PNS were fractionated in 14% iodixanol gradients, immunoblotted for GLUT4 and IRAP in parallel with (B), and plotted as solid curves. The dotted curves representing basal controls were taken from (B). The insulin effect shown is representative of two independent experiments. T1 KD, tankyrase 1 knockdown.
Figure 7
Figure 7. Effect of PJ34 on tankyrase autoPARsylation and GLUT4/IRAP trafficking
(A) Day 8 adipocytes were treated with PJ34 (lane 1; 80 μM for 45 min) or without (lane 2). Detergent-soluble extracts were incubated with GST–IRAPaa78-109 resins to pull down tankyrase. The precipitates were sequentially immunoblotted for poly(ADP-ribose) epitopes (left-hand panel) and tankyrase (right-hand panel). (B) Serum-starved day 8 adipocytes were pretreated with 80 μM PJ34 (open bars) or without (solid bars) for 45 min. Basal and insulin-stimulated [3H]deoxy-D-glucose uptake was determined (means±S.E.M. of four wells). The result shown is representative of three other experiments using similar PJ34 concentrations for various durations. (C) Serum-starved day 8 adipocytes were treated with PJ34 (80 μM for 45 min) and then with insulin (20 nM for 20 min) as indicated. The PM content of the indicated proteins was determined as in Figure 1(C). The bar graph shows the means±S.E.M. of two basal and four insulin-stimulated samples combined from two experiments. A representative set of immunoblots is shown in the right-hand panel. (D) Serum-starved day 8 adipocytes were treated with PJ34 (80 μM for 1 h, solid curves) or without (dotted curves). PNS were fractionated in 14% iodixanol gradients as in Figure 6, and the immunoblots were quantified also as in Figure 6. The PJ34 effect shown is representative of three independent experiments. PJ, PJ34; Ctrl, control.

Similar articles

Cited by

References

    1. Bryant N. J., Govers R., James D. E. Regulated transport of the glucose transporter GLUT4. Nat. Rev. Mol. Cell. Biol. 2002;3:267–277. - PubMed
    1. Keller S. R. The insulin-regulated aminopeptidase: a companion and regulator of GLUT4. Front. Biosci. 2003;8:S410–S420. - PubMed
    1. Ducluzeau P. H., Fletcher L. M., Vidal H., Laville M., Tavare J. M. Molecular mechanisms of insulin-stimulated glucose uptake in adipocytes. Diabetes Metab. 2002;28:85–92. - PubMed
    1. Mora S., Pessin J. E. An adipocentric view of signaling and intracellular trafficking. Diabetes Metab. Res. Rev. 2002;18:345–356. - PubMed
    1. Chen D., Elmendorf J. S., Olson A. L., Li X., Earp H. S., Pessin J. E. Osmotic shock stimulates GLUT4 translocation in 3T3L1 adipocytes by a novel tyrosine kinase pathway. J. Biol. Chem. 1997;272:27401–27410. - PubMed

Publication types

MeSH terms