Evaluating different methods of microarray data normalization
- PMID: 17059609
- PMCID: PMC1636075
- DOI: 10.1186/1471-2105-7-469
Evaluating different methods of microarray data normalization
Abstract
Background: With the development of DNA hybridization microarray technologies, nowadays it is possible to simultaneously assess the expression levels of thousands to tens of thousands of genes. Quantitative comparison of microarrays uncovers distinct patterns of gene expression, which define different cellular phenotypes or cellular responses to drugs. Due to technical biases, normalization of the intensity levels is a pre-requisite to performing further statistical analyses. Therefore, choosing a suitable approach for normalization can be critical, deserving judicious consideration.
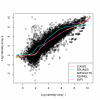
Results: Here, we considered three commonly used normalization approaches, namely: Loess, Splines and Wavelets, and two non-parametric regression methods, which have yet to be used for normalization, namely, the Kernel smoothing and Support Vector Regression. The results obtained were compared using artificial microarray data and benchmark studies. The results indicate that the Support Vector Regression is the most robust to outliers and that Kernel is the worst normalization technique, while no practical differences were observed between Loess, Splines and Wavelets.
Conclusion: In face of our results, the Support Vector Regression is favored for microarray normalization due to its superiority when compared to the other methods for its robustness in estimating the normalization curve.
Figures


Similar articles
-
Normalization and analysis of DNA microarray data by self-consistency and local regression.Genome Biol. 2002 Jun 28;3(7):RESEARCH0037. doi: 10.1186/gb-2002-3-7-research0037. Epub 2002 Jun 28. Genome Biol. 2002. PMID: 12184811 Free PMC article.
-
Impact of DNA microarray data transformation on gene expression analysis - comparison of two normalization methods.Acta Biochim Pol. 2011;58(4):573-80. Epub 2011 Dec 20. Acta Biochim Pol. 2011. PMID: 22187680
-
Effect of various normalization methods on Applied Biosystems expression array system data.BMC Bioinformatics. 2006 Dec 15;7:533. doi: 10.1186/1471-2105-7-533. BMC Bioinformatics. 2006. PMID: 17173684 Free PMC article.
-
Normalization and quantification of differential expression in gene expression microarrays.Brief Bioinform. 2006 Jun;7(2):166-77. doi: 10.1093/bib/bbl002. Epub 2006 Mar 7. Brief Bioinform. 2006. PMID: 16772260 Review.
-
Extrapolating traditional DNA microarray statistics to tiling and protein microarray technologies.Methods Enzymol. 2006;411:282-311. doi: 10.1016/S0076-6879(06)11015-0. Methods Enzymol. 2006. PMID: 16939796 Review.
Cited by
-
Long Non-coding RNA AGAP2-AS1 Silencing Inhibits PDLIM5 Expression Impeding Prostate Cancer Progression via Up-Regulation of MicroRNA-195-5p.Front Genet. 2020 Sep 25;11:1030. doi: 10.3389/fgene.2020.01030. eCollection 2020. Front Genet. 2020. PMID: 33101368 Free PMC article.
-
LINC01093 Upregulation Protects against Alcoholic Hepatitis through Inhibition of NF-κB Signaling Pathway.Mol Ther Nucleic Acids. 2019 Sep 6;17:791-803. doi: 10.1016/j.omtn.2019.06.018. Epub 2019 Jun 29. Mol Ther Nucleic Acids. 2019. PMID: 31450097 Free PMC article.
-
Cellular Signaling Pathways in Insulin Resistance-Systems Biology Analyses of Microarray Dataset Reveals New Drug Target Gene Signatures of Type 2 Diabetes Mellitus.Front Physiol. 2017 Jan 25;8:13. doi: 10.3389/fphys.2017.00013. eCollection 2017. Front Physiol. 2017. PMID: 28179884 Free PMC article.
-
High expression of FLT3 is a risk factor in leukemia.Mol Med Rep. 2018 Feb;17(2):2885-2892. doi: 10.3892/mmr.2017.8232. Epub 2017 Dec 8. Mol Med Rep. 2018. PMID: 29257272 Free PMC article.
-
Screening of osteoprotegerin-related feature genes in osteoporosis and functional analysis with DNA microarray.Eur J Med Res. 2013 Jun 3;18(1):15. doi: 10.1186/2047-783X-18-15. Eur J Med Res. 2013. PMID: 23731710 Free PMC article.
References
-
- Durbin BP, Hardin JS, Hawkins DM, Rocke DM. A variance-stabilizing transformation for gene-expression microarray data. Bioinformatics. 2002;18:S105–110. - PubMed
Publication types
MeSH terms
LinkOut - more resources
Full Text Sources

