Comparative Study
. 2006 Oct 30;203(11):2519-27.
doi: 10.1084/jem.20061692. Epub 2006 Oct 23.

A role for Dicer in immune regulation

Affiliations
Comparative Study

A role for Dicer in immune regulation

Bradley S Cobb et al. J Exp Med. .

Abstract

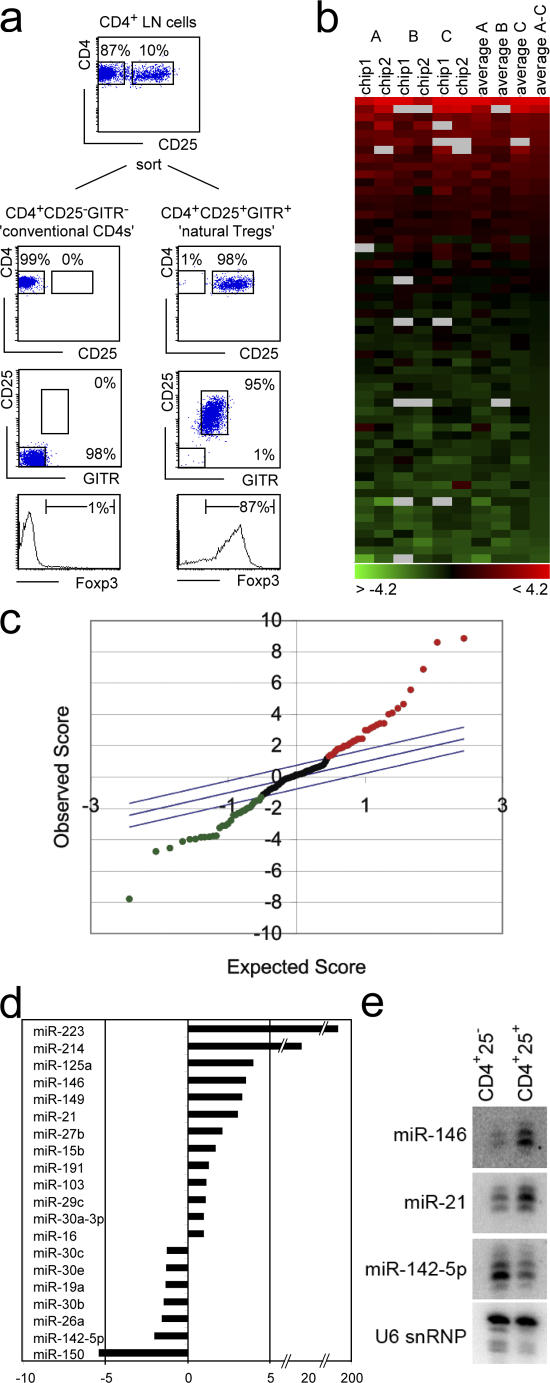
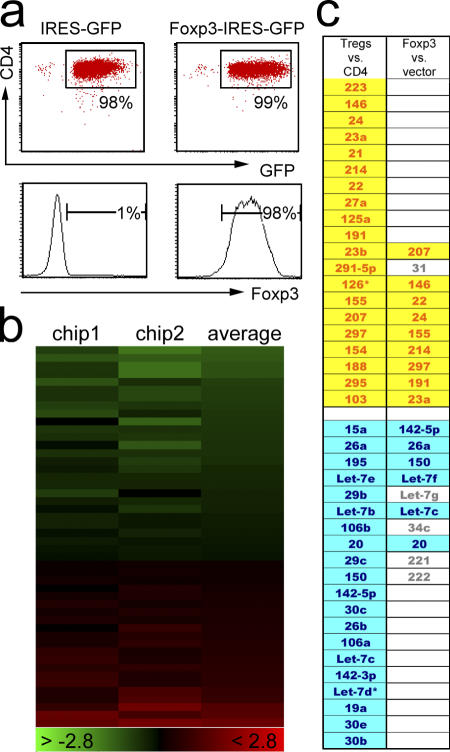
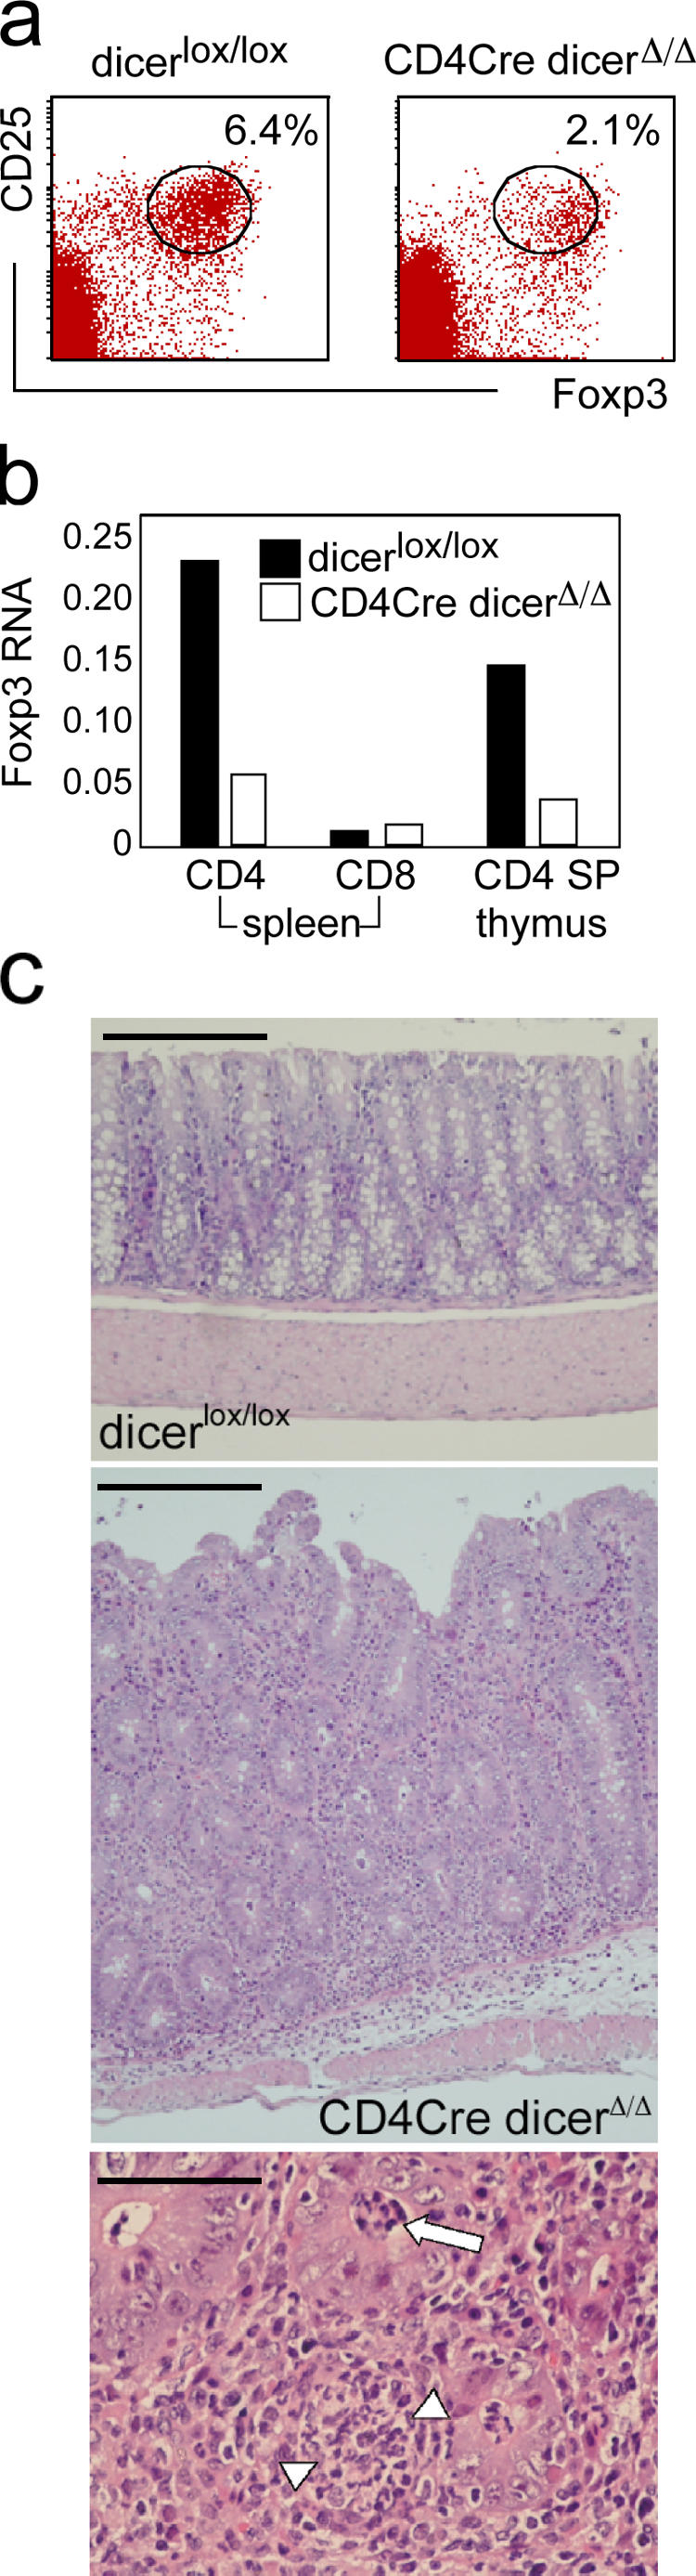
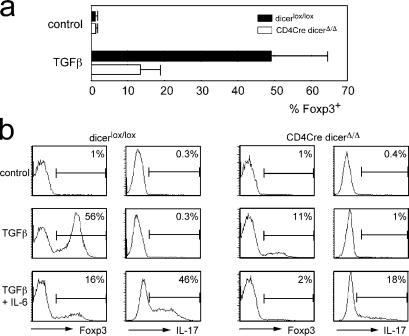
Micro RNAs (miRNAs) regulate gene expression at the posttranscriptional level. Here we show that regulatory T (T reg) cells have a miRNA profile distinct from conventional CD4 T cells. A partial T reg cell-like miRNA profile is conferred by the enforced expression of Foxp3 and, surprisingly, by the activation of conventional CD4 T cells. Depleting miRNAs by eliminating Dicer, the RNAse III enzyme that generates functional miRNAs, reduces T reg cell numbers and results in immune pathology. Dicer facilitates, in a cell-autonomous fashion, the development of T reg cells in the thymus and the efficient induction of Foxp3 by transforming growth factor beta. These results suggest that T reg cell development involves Dicer-generated RNAs.


Figures

Figure 1.
Figure 1.
The miRNA profile of natural T reg cells is distinct from that of conventional CD4+CD25 T cells. (a) Natural T reg cells and conventional CD4 LN T cells were isolated as CD4+25+GITR+ and CD4+25GITR populations. Intracellular staining confirmed the expression of Foxp3 in the CD4+25+GITR but not the CD4+25GITR subset. (b) Low molecular weight RNA from conventional T cells and T reg cells was labeled with Cy3 and Cy5 and hybridized to microarrays containing oligonucleotide probes corresponding to the known miRNA sequences. The heat map summarizes three biological replicates (A–C) and six technical replicates, including dye swaps for each set. Red indicates overexpression in T reg cells, green indicates underexpression in T reg cells, and gray indicates no signal. (c) Scatter plot of differential miRNA expression between T reg cells and conventional CD4 T cells according to the SAM algorithm. Data points outside the diagonal blue lines are differentially expressed. miRNAs up-regulated in T reg cells are shown in red, and miRNAs down-regulated in T reg cells are shown in green. (d) Differential miRNA expression by real-time PCR analysis of mature miRNAs. 24 miRNAs were analyzed and the real-time PCR results confirmed the array data in all but two cases (miR-15a and 191), which we omitted from our subsequent analysis. (e) Differential miRNA expression confirmed by Northern blotting. Microarray data is available under accession number GSE6003.
Figure 2.
Figure 2.
The T reg cell miRNA expression profile bears an activation signature. (a) miRNA array comparison of 72-h activated T cells versus naive T cells. Conventional CD4+25 T cells were sorted and activated using plate-bound anti-TCR and anti-CD28. Low molecular weight RNA was extracted from freshly isolated CD4+25 T cells and after 1, 3, and 10 d of activation and hybridized to miRNA arrays as in Fig. 1. (b) T cell activation results in the up-regulation of several miRNAs that are overexpressed in T reg cells (highlighted in yellow) and in the down-regulation of several miRNAs that are underexpressed in T reg cells (highlighted in blue). A kinetic analysis of day 1, 3, and 10 time points is presented in Fig. S1. (c) miRNA expression ratios between T reg cells/naive CD4 T cells are plotted against activated CD4/naive CD4 for days 1, 3, and 10 after activation. A positive correlation develops by day 1 after activation, increases in significance by day 3, and declines by day 10. Microarray data is available under accession number GSE6006.
Figure 3.
Figure 3.
Foxp3 confers aspects of the T reg cell miRNA profile. (a) CD4+CD25 cells activated overnight with plate-bound anti-TCR and anti-CD28 were transduced with Foxp3-IRES-GFP or IRES-GFP control vector. GFP-expressing cells were sorted 72 or 96 h later, and intracellular staining of GFP+ cells confirmed Foxp3 expression in Foxp3-IRES-GFP–transduced but not in control cells. (b) miRNA microarray analysis of Foxp3-IRES-GFP– versus IRES-GFP–transduced cells 72 h after Foxp3 transduction. The experiment was repeated at 96 h after Foxp3 transduction (not depicted). (c) Foxp3-transduced CD4 T cells overexpress and underexpress a subset of miRNAs that are overexpressed (yellow) or underexpressed (blue) in natural T reg cells (from Fig. 1). Microarray data is available under accession number GSE6007.
Figure 4.
Figure 4.
Reduced numbers of natural T reg cells and immune pathology in the absence of the miRNA-generating RNase III enzyme Dicer. (a) Splenocytes from CD4Cre dicer Δ/Δ mice and dicer lox/lox controls were stained for CD4, CD25, and Foxp3 gated on CD4-expressing cells. (b) Quantitative RT-PCR of Foxp3 RNA levels in dicer lox/lox and CD4Cre dicer Δ/Δ CD4+ and CD8+ splenocytes and CD4 SP thymocytes. (c) Top: Normal colonic mucosa of a dicer lox/lox control mouse (Bar, 400 μm). Middle: Colon histology of a CD4Cre dicer Δ/Δ mouse with active colitis. The lamina propria shows a dense infiltrate of inflammatory cells with a sparse infiltrate extending into the submucosa (Bar, 400 μm). Bottom: High power view of CD4Cre dicer Δ/Δ colonic mucosa with crypt abscess formation (arrow), focal gland destruction, and abscess formation (arrowheads; Bar, 100 μm).
Figure 5.
Figure 5.
Dicer is required cell autonomously for the differentiation of natural T reg cells in the thymus. (a) E15 thymi were explanted into organ culture and 10 d later analyzed for CD4, CD8, and T reg cell markers. The expression profile of CD25 and CD69 or Foxp3 and GITR is shown for CD4 SP thymocytes. Note that lckCre dicer Δ/Δ thymi fail to generate a substantial population of natural T reg cells. (b) Mixed thymus chimeras were constructed (reference 34) consisting of a wild-type component marked by the Thy1.1 alloantigen and a Thy1.2 component consisting of either dicer lox/lox controls or lckCre dicer Δ/Δ. e15-17 thymi were dissociated by proteolysis, mixed as indicated, reaggregated, and cultured. After 7–10 d, thymocytes were stained for Thy1.1, CD4, CD8, CD25, and GITR and analyzed by five-color flow cytometry. The expression of CD25 and GITR (used to define T reg cells) was determined separately for Thy1.1+ and Thy1.1 CD4 SP cells. Note that Thy1.2 dicer lox/lox controls but not Thy1.2 lckCre dicer Δ/Δ thymocytes generate T reg cells in mixed chimeras with wild-type Thy1.1 cells.
Figure 6.
Figure 6.
Dicer facilitates the induction of Foxp3 in CD4+CD25 cells. (a) Sorted CD4Cre dicer Δ/Δ or control dicer lox/lox CD4+CD25 LN T cells were activated with 200 ng/ml of plate-bound anti-TCR (H57) and anti-CD28 with or without 1 ng/ml of recombinant TGF-β1 (Sigma-Aldrich). Expression of Foxp3 was assayed 2 d later by intracellular staining (mean ± SD, n = 6). (b) CD4+CD25 LN T cells were activated as in (a) in the presence of 50 ng/ml IL-6 (R &D Systems) and/or 1 ng/ml TGF-β1. Foxp3 expression was assayed as in (a). 5 d after activation the cells were restimulated with PMA and Ca2+ ionophore in the presence of brefeldin A and assayed for IL-17 expression by intracellular staining.

References

    1. Fisher, A.G. 2002. Cellular identity and lineage choice. Nat. Rev. Immunol. 2:977–982. - PubMed
    1. Bartel, D.P. 2004. MicroRNAs: genomics, biogenesis, mechanism, and function. Cell. 116:281–297. - PubMed
    1. Denli, A.M., B.B. Tops, R.H. Plasterk, R.F. Ketting, and G.J. Hannon. 2004. Processing of primary microRNAs by the Microprocessor complex. Nature. 432:231–235. - PubMed
    1. Gregory, R.I., K.P. Yan, G. Amuthan, T. Chendrimada, B. Doratotaj, N. Cooch, and R. Shiekhattar. 2004. The Microprocessor complex mediates the genesis of microRNAs. Nature. 432:235–240. - PubMed
    1. Chendrimada, T.P., R.I. Gregory, E. Kumaraswamy, J. Norman, N. Cooch, K. Nishikura, and R. Shiekhattar. 2005. TRBP recruits the Dicer complex to Ago2 for microRNA processing and gene silencing. Nature. 436:740–744. - PMC - PubMed

Publication types

MeSH terms