. 2006 Oct 31;103(44):16123-8.
doi: 10.1073/pnas.0608022103. Epub 2006 Oct 23.

Crystal structure of a photoactivated deprotonated intermediate of rhodopsin

Affiliations

Crystal structure of a photoactivated deprotonated intermediate of rhodopsin

David Salom et al. Proc Natl Acad Sci U S A. .

Abstract

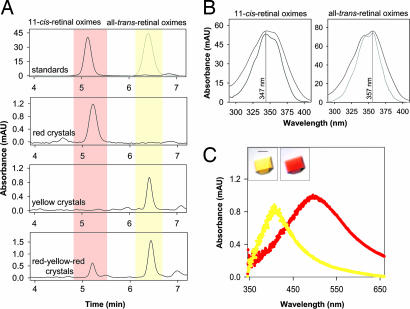
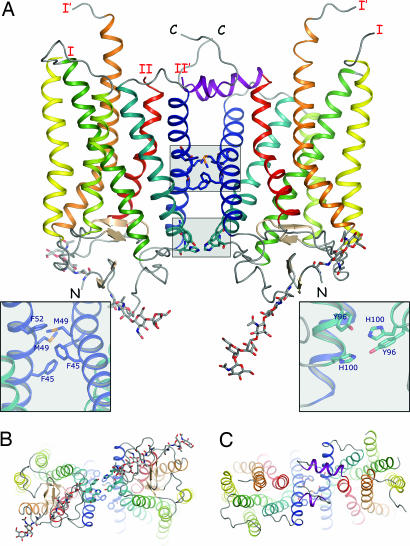
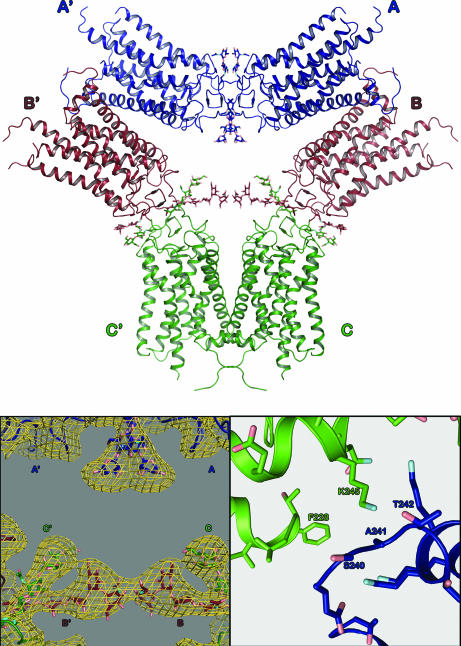
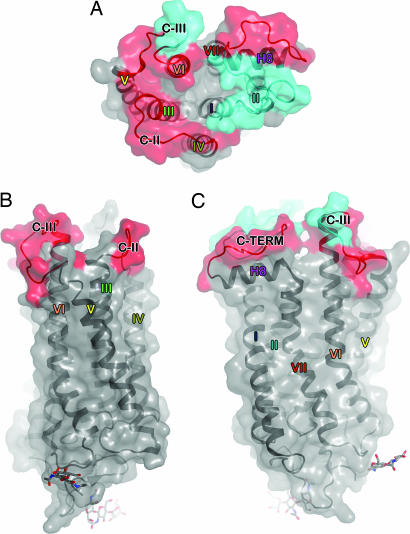
The changes that lead to activation of G protein-coupled receptors have not been elucidated at the structural level. In this work we report the crystal structures of both ground state and a photoactivated deprotonated intermediate of bovine rhodopsin at a resolution of 4.15 A. In the photoactivated state, the Schiff base linking the chromophore and Lys-296 becomes deprotonated, reminiscent of the G protein-activating state, metarhodopsin II. The structures reveal that the changes that accompany photoactivation are smaller than previously predicted for the metarhodopsin II state and include changes on the cytoplasmic surface of rhodopsin that possibly enable the coupling to its cognate G protein, transducin. Furthermore, rhodopsin forms a potentially physiologically relevant dimer interface that involves helices I, II, and 8, and when taken with the prior work that implicates helices IV and V as the physiological dimer interface may account for one of the interfaces of the oligomeric structure of rhodopsin seen in the membrane by atomic force microscopy. The activation and oligomerization models likely extend to the majority of other G protein-coupled receptors.


Conflict of interest statement

The authors declare no conflict of interest.

Figures

Fig. 1.
Fig. 1.
Analysis of retinoid content and absorption spectra of single rhodopsin crystals. (A) Representative chromatograms showing detection and separation of the retinal oxime isomers found in red, yellow, and red-reverted rhodopsin crystals. Identification of the 11-cis and all-trans isomers of retinal oximes was based on comparisons of elution times and absorbance spectra to synthetic standards plotted in the top panel. The chromatograms shown are representative of 20 single crystal measurements. Similar results were obtained in 10 independent experiments. (B) Absorption spectra of the peak confirm the identity of isomerization state of the chromophore in red (Left) and yellow (Right) crystals. Black and gray lines correspond to the normalized spectra of the standards and samples, respectively. (C) Absorption spectra of ground-state rhodopsin (red) and photoactivated (yellow) crystals. Photoactivation of rhodopsin in the red crystals induces a shift of its maximum absorbance from 500 nm to ≈380 nm characteristic of the Meta II state of rhodopsin. (Scale bar: 0.1 mm.)
Fig. 2.
Fig. 2.
Structure of photoactivated rhodopsin. (A) The A and B subunits form a dimer along helices I and II. This dimer contact depends upon three small areas of contact. The main interaction involves hydrophobic contacts at the level of Phe-45 (1.30), Met-49 (1.34), and Phe-52 (1.37) residues on both subunits (Left Inset). This interaction is further enhanced by two polar interactions between Tyr-96 (2.63) and His-100 (2.67) on adjacent molecules (Right Inset) and a hydrophobic contact between the palmitoylate group covalently attached to Cys-322 in one subunit and the protein backbone of residues 308 and 309 in the opposite subunit (data not shown). Formation of this dimer buries only ≈800 Å of surface area. Right Inset has been rotated ≈90° about the horizontal axis for clarity. The C subunit forms a similar crystallographic dimer with one of its symmetry-related copies with similar buried surface area and contacts. Helices are denoted by color: H-I, blue; H-II, teal; H-III, green; H-IV, yellow-green; H-V, yellow; H-VI, orange; H-VII, red; H-8, purple. Loops C-II and C-III are partially disordered in the photoactivated structure, and the last and first observed residues in the structure are labeled I/I′ and II/II′, respectively. N and C denote the respective termini of the protein. (B) The cytoplasmic face of the dimer. (C) The extracellular face of the dimer. All molecular graphics representations were generated with PYMOL (34).
Fig. 3.
Fig. 3.
Superassembly of rhodopsin dimers found in the unit cell. (Upper) The trimeric assembly of rhodopsin dimers is held together by interactions between their extracellular regions. These interactions are further strengthened by interactions between the polysaccharide chains of each molecule. This interface, which buries ≈2,400 Å2, is the most extensive in the crystallographic unit cell. The hexameric superassembly consists of two asymmetric units (ASU). A similar superassembly is seen in the rhombohedral (R32) crystal form. Chains in one ASU are denoted with the letters A, B, and C, and in the other ASU they are denoted A′, B′, and C′. Monomers A, B, and C are colored blue, red, and green, respectively, and pertinent oxygen and nitrogen atoms are denoted in pink and cyan, respectively, for clarity. (Lower Left) A 3-fold averaged, density modified map calculated by using DM, contoured at 1σ, clearly indicates that the polysaccharide chains wrap around one another to strengthen this interface. Additionally, σA-weighted 2 FoFc maps also are consistent with these structures for the polysaccharides. (Lower Right) The interface between adjacent superassemblies (not shown in Upper), only buries ≈500 Å2 of surface area and consists of both charged and hydrophobic interactions. The 2 FoFc density for this region in the photoactivated crystals is discontinuous, and no FoFc density is observed in this region. Because this interface is minimal, the rhodopsin is largely unconstrained, and the crystal is capable of accommodating the small conformational changes associated with photoactivation. The small extent of the intermonomer contacts could also account for the limited resolution.
Fig. 4.
Fig. 4.
Differences between ground-state and photoactivated structures. Regions found to be disordered and not observed in all three subunits in the photoactivated structure are depicted in cyan. Regions that are found in different orientations in the photoactivated structure when compared with their equivalent subunit in the low-resolution ground-state structure are denoted in red on a molecular surface representation of the most complete rhodopsin structure to date (Protein Data Bank ID code 1U19). The regions of the cytoplasmic surface that are mobile are important for activation of transducin [cytoplasmic loop II (C-II), cytoplasmic loop III (C-III), and the C terminus]. Because of the low resolution and completeness of the trigonal data sets, estimated coordinate errors were calculated with the program ESCET, indicating coordinate precisions of 1.4 and 1.1 Å for the photoactivated and ground-state data sets, respectively. Differences of less than these amounts are within experimental error at this resolution (see Supporting Text). (A) View of the intracellular side of rhodopsin. (B and C) Side views of the monomer. C depicts the monomer after a 90° rotation about the vertical axis.

References

    1. Foord SM, Bonner TI, Neubig RR, Rosser EM, Pin JP, Davenport AP, Spedding M, Harmar AJ. Pharmacol Rev. 2005;57:279–288. - PubMed
    1. Palczewski K. Annu Rev Biochem. 2006;75:743–767. - PMC - PubMed
    1. Palczewski K, Kumasaka T, Hori T, Behnke CA, Motoshima H, Fox BA, Le Trong I, Teller DC, Okada T, Stenkamp RE, et al. Science. 2000;289:739–745. - PubMed
    1. Li J, Edwards PC, Burghammer M, Villa C, Schertler GF. J Mol Biol. 2004;343:1409–1438. - PubMed
    1. Okada T, Sugihara M, Bondar AN, Elstner M, Entel P, Buss V. J Mol Biol. 2004;342:571–583. - PubMed