. 2006 Oct 31;103(44):16544-9.
doi: 10.1073/pnas.0605573103. Epub 2006 Oct 23.

Tactile guidance of prey capture in Etruscan shrews

Affiliations

Tactile guidance of prey capture in Etruscan shrews

Farzana Anjum et al. Proc Natl Acad Sci U S A. .

Abstract

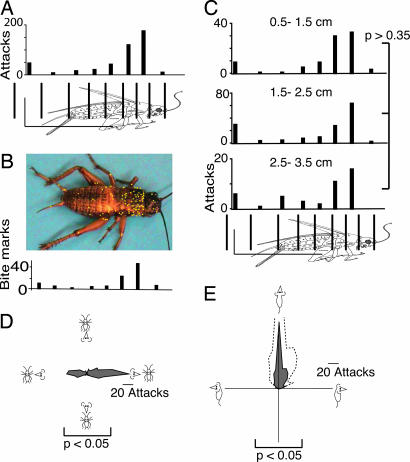
Whereas visuomotor behaviors and visual object recognition have been studied in detail, we know relatively little about tactile object representations. We investigate a new model system for the tactile guidance of behavior, namely prey (cricket) capture by one of the smallest mammals, the Etruscan shrew, Suncus etruscus. Because of their high metabolic rate and nocturnal lifestyle, Etruscan shrews are forced to detect, overwhelm, and kill prey in large numbers in darkness. Crickets are exquisitely mechanosensitive, fast-moving prey, almost as big as the shrew itself. Shrews succeed in hunting by lateralized, precise, and fast attacks. Removal experiments demonstrate that both macrovibrissae and microvibrissae are required for prey capture, with the macrovibrissae being involved in attack targeting. Experiments with artificial prey replica show that tactile shape cues are both necessary and sufficient for evoking attacks. Prey representations are motion- and size-invariant. Shrews distinguish and memorize prey features. Corrective maneuvers and cricket shape manipulation experiments indicate that shrew behavior is guided by Gestalt-like prey descriptions. Thus, tactile object recognition in Etruscan shrews shares characteristics of human visual object recognition, but it proceeds faster and occurs in a 20,000-times-smaller brain.


Conflict of interest statement

The authors declare no conflict of interest.

Figures

Fig. 1.
Fig. 1.
Etruscan shrews and crickets. (A) An Etruscan shrew and a field cricket. The € cent coin is 16.25 mm in diameter. (B) Head of an Etruscan shrew with whisker array. The scale shows millimeters. (C) Frontal view of the head of an Etruscan shrew. (D) High-magnification view of the microvibrissae surrounding the shrew's mouth.
Fig. 2.
Fig. 2.
Cricket attack sequence (see also Movie 1). Sequence of stills from an attack sequence in a 7-cm × 7-cm box. Time is shown at the bottom of each image and runs in horizontal lines from top left to bottom right. The top left image is taken immediately before the attacks. The next 10 images show the end point of attack frames of 10 consecutive attacks on the same cricket. Shortly after these attacks the shrew takes a break (bottom right). Many attacks target the thoracic region (640, 1,000, 1,160, 1280, 1,800, and 2,000 ms).
Fig. 3.
Fig. 3.
Spatial analysis of shrew attacks. (A) Attack histogram. Histogram (Upper) of shrew attacks (from nine shrews) over nine cricket body parts (shown schematically in Lower) (n = 450 shrew attacks on ≈130 crickets). (B) Bite mark analysis. (Upper) Bite mark positions (yellow squares) superimposed on a cricket photograph (n = 94 bite marks on 25 freshly killed, immobilized, or injured crickets). (Lower) Bite mark histogram. (C) Attack histograms for different-sized prey. Data are as in A. The effects of prey size on attack location were evaluated by using a Poisson regression model. (D) Polar plot of attack directions (of the shrew's rostrum) relative to the cricket's body axis (angle β in Fig. 7B). Left and right side attack directions (counted in 10° bins) were compared by a two-tailed paired t test. (E) Polar plot of attack directions (of the shrew's rostrum) relative to the shrew's body axis (angle α in Fig. 7B). Dashed outline: Same data as shown in gray but multiplied by two without inclusion of the forward direction. Leftward and rightward attack directions (counted in 10° bins) were compared by a two-tailed paired t test.
Fig. 4.
Fig. 4.
Attack latencies, intervals, and sequencing. (A) Histogram of attack latencies (time to completion of first attacks). The time from encounter to the end point of an attack on a cricket was measured; only the first attack of a shrew on a given cricket was included (n = 64 first attacks). (B) Histogram of interattack intervals (time from attack end point to attack end point). Only intervals of directly subsequent attacks were included (n = 180 attack intervals). (C) Attack sequencing. Effects of attack number on attack location were evaluated by using a Poisson regression model.
Fig. 5.
Fig. 5.
Microvibrissae and macrovibrissae removal effects. (A) Count of aborted (open) and completed (filled) attacks on crickets in three shrews before (Upper) and after (Lower) microvibrissae removal. (B) Attack histogram for completed attacks in three shrews before (Upper) and after (Lower) microvibrissae removal. (C) Aborted (open) and completed (filled) attacks on crickets in three shrews before (Upper) and after (Lower) macrovibrissae removal. (D) Attack histogram for completed attacks in three shrews before (Top) and after (Middle) macrovibrissae removal. Effects of whisker removal on completed vs. aborted attacks were evaluated by using (a Yates-corrected) Pearson's χ2 test. Effects of whisker removal on attack location were evaluated by using a Poisson regression model.
Fig. 6.
Fig. 6.
Attacks on plastic and shape-manipulated crickets. (A) Control objects and plastic cricket on a centimeter scale. (B) Number of attacks per object for five shrews. (C) Attack histogram (Upper) from three shrews for control crickets with glue (blue dot in the cricket schematic in Lower) applied to their heads. See also Fig. 8B Left. (D) Attack histogram (Upper) from the same three shrews for shape- manipulated crickets with an extra pair of jumping legs (red in the cricket schematic in Lower) glued (blue in Lower) to their heads. Attacks on the added pair of jumping legs are given in red. See also Fig. 8B Right. Effects of shape manipulation on attack location were evaluated by using a Poisson regression model.

References

    1. Tinbergen N. The Study of Instinct. Oxford: Clarendon; 1951.
    1. von Uexküll JJ. Umwelt und Innenwelt der Tiere. Berlin: Springer; 1909.
    1. Ewert JP, Arend B, Becker V, Borchers HW. Brain Behav Evol. 1979;16:38–51. - PubMed
    1. Ewert JP. In: Comparative Neurology of the Optic Tectum. Vanegas H, editor. New York: Plenum; 1984. pp. 247–416.
    1. Treisman A, Gelade G. Cognit Psychol. 1980;12:97–136. - PubMed

Publication types