

Do self-report instruments allow meaningful comparisons across diverse population groups? Testing measurement invariance using the confirmatory factor analysis framework
- PMID: 17060839
- PMCID: PMC1808350
- DOI: 10.1097/01.mlr.0000245454.12228.8f
Do self-report instruments allow meaningful comparisons across diverse population groups? Testing measurement invariance using the confirmatory factor analysis framework
Abstract
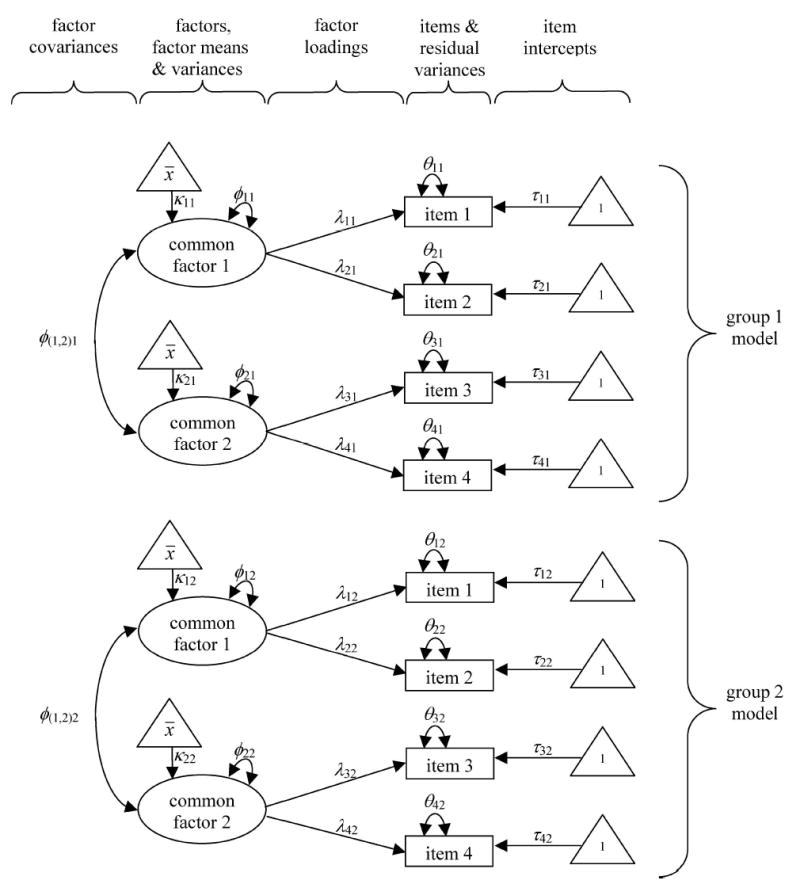
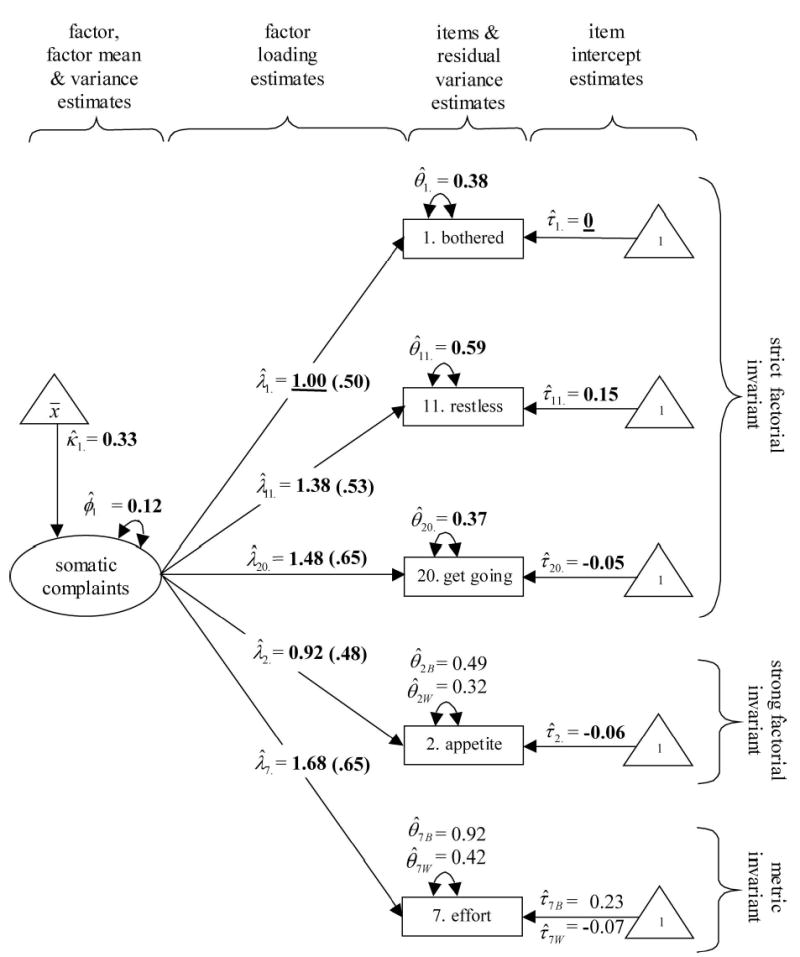
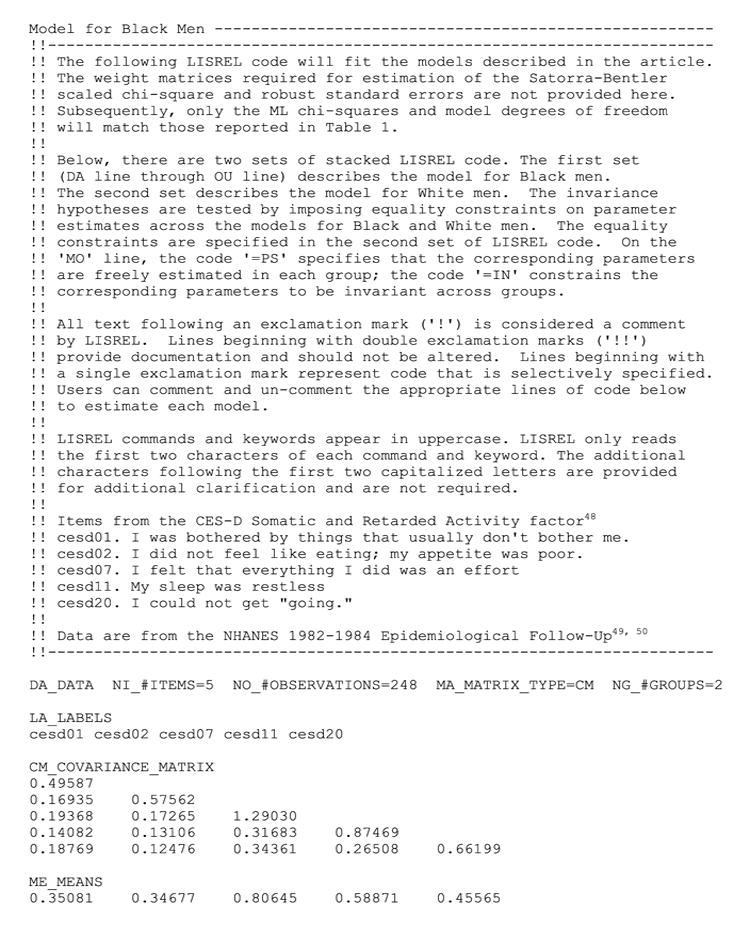
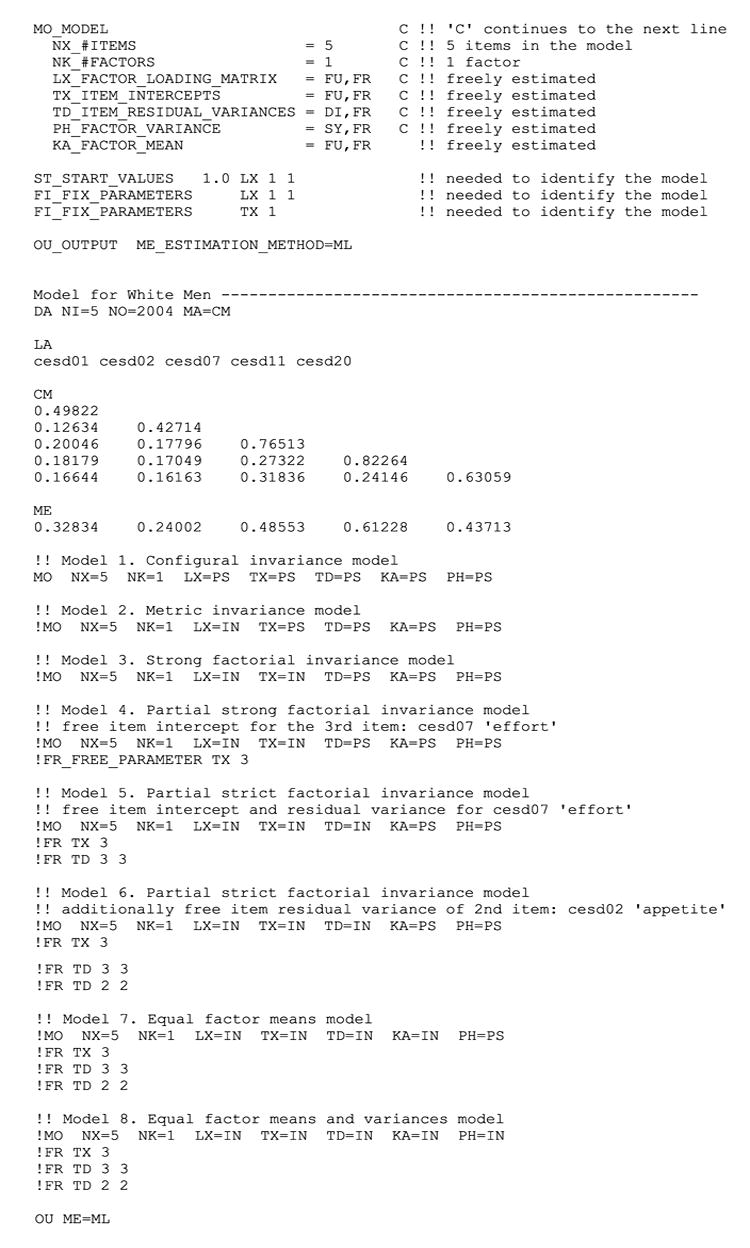
Comparative public health research makes wide use of self-report instruments. For example, research identifying and explaining health disparities across demographic strata may seek to understand the health effects of patient attitudes or private behaviors. Such personal attributes are difficult or impossible to observe directly and are often best measured by self-reports. Defensible use of self-reports in quantitative comparative research requires not only that the measured constructs have the same meaning across groups, but also that group comparisons of sample estimates (eg, means and variances) reflect true group differences and are not contaminated by group-specific attributes that are unrelated to the construct of interest. Evidence for these desirable properties of measurement instruments can be established within the confirmatory factor analysis (CFA) framework; a nested hierarchy of hypotheses is tested that addresses the cross-group invariance of the instrument's psychometric properties. By name, these hypotheses include configural, metric (or pattern), strong (or scalar), and strict factorial invariance. The CFA model and each of these hypotheses are described in nontechnical language. A worked example and technical appendices are included.
Figures
Similar articles
-
An essay on measurement and factorial invariance.Med Care. 2006 Nov;44(11 Suppl 3):S69-77. doi: 10.1097/01.mlr.0000245438.73837.89. Med Care. 2006. PMID: 17060838 Review.
-
Social determinants of alcohol and cigarette use by race/ethnicity: Can we ignore measurement issues?Psychol Assess. 2020 Nov;32(11):1075-1086. doi: 10.1037/pas0000948. Epub 2020 Sep 14. Psychol Assess. 2020. PMID: 32924524 Free PMC article.
-
Measurement invariance of the PROMIS pain interference item bank across community and clinical samples.Qual Life Res. 2013 Apr;22(3):501-7. doi: 10.1007/s11136-012-0191-x. Epub 2012 May 3. Qual Life Res. 2013. PMID: 22552604 Free PMC article.
-
Measurement of social support across women from four ethnic groups: evidence of factorial invariance.J Cross Cult Gerontol. 2010 Mar;25(1):45-58. doi: 10.1007/s10823-010-9111-0. J Cross Cult Gerontol. 2010. PMID: 20182911 Free PMC article.
-
Measurement issues in health disparities research.Health Serv Res. 2005 Oct;40(5 Pt 2):1640-57. doi: 10.1111/j.1475-6773.2005.00450.x. Health Serv Res. 2005. PMID: 16179000 Free PMC article. Review.
Cited by
-
Response shift in coronary artery disease.Qual Life Res. 2024 Mar;33(3):767-776. doi: 10.1007/s11136-023-03564-1. Epub 2023 Dec 22. Qual Life Res. 2024. PMID: 38133786
-
A cross-cultural re-evaluation of the Exercise Addiction Inventory (EAI) in five countries.Sports Med Open. 2015 Dec;1(1):5. doi: 10.1186/s40798-014-0005-5. Epub 2015 Jan 20. Sports Med Open. 2015. PMID: 27747842 Free PMC article.
-
Longitudinal measurement invariance in prospective oral health-related quality of life assessment.Health Qual Life Outcomes. 2016 Jun 7;14:88. doi: 10.1186/s12955-016-0492-9. Health Qual Life Outcomes. 2016. PMID: 27267885 Free PMC article.
-
Health anxiety, coping mechanisms and COVID 19: An Indian community sample at week 1 of lockdown.PLoS One. 2021 Apr 21;16(4):e0250336. doi: 10.1371/journal.pone.0250336. eCollection 2021. PLoS One. 2021. PMID: 33882109 Free PMC article.
-
Which Boys and Which Girls Are Falling Behind? Linking Adolescents' Gender Role Profiles to Motivation, Engagement, and Achievement.J Youth Adolesc. 2021 Feb;50(2):336-352. doi: 10.1007/s10964-020-01293-z. Epub 2020 Jul 31. J Youth Adolesc. 2021. PMID: 32734562 Free PMC article.
References
-
- Little TD. Mean and covariance structures (MACS) analyses of cross-cultural data: practical and theoretical issues. Multivariate Behav Res. 1997;32:53–76. - PubMed
-
- Meredith W. Measurement invariance, factor analysis and factorial invariance. Psychometrika. 1993;58:525–543.
-
- Millsap RE. Group differences in regression intercepts: implications for factorial invariance. Multivariate Behav Res. 1998;33:403–424. - PubMed
-
- Yoo B. Cross-group comparisons: a cautionary note. Psychology and Marketing. 2002;19:357–368.
-
- Nunnally JC. Psychometric Theory. New York: McGraw Hill; 1978.
Publication types
MeSH terms
Grants and funding
LinkOut - more resources
Full Text Sources
Molecular Biology Databases
