

Gene expression profiling reveals consistent differences between clinical samples of human leukaemias and their model cell lines
- PMID: 17061979
- PMCID: PMC1654200
- DOI: 10.1111/j.1365-2141.2006.06342.x
Gene expression profiling reveals consistent differences between clinical samples of human leukaemias and their model cell lines
Abstract
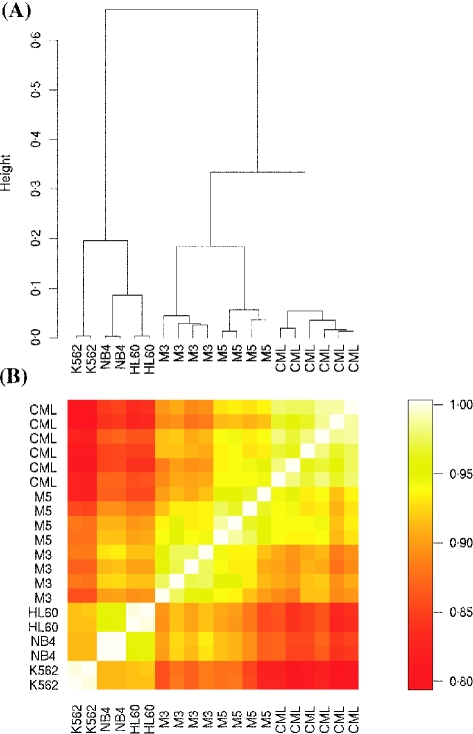
Microarray gene expression profiles of fresh clinical samples of chronic myeloid leukaemia in chronic phase, acute promyelocytic leukaemia and acute monocytic leukaemia were compared with profiles from cell lines representing the corresponding types of leukaemia (K562, NB4, HL60). In a hierarchical clustering analysis, all clinical samples clustered separately from the cell lines, regardless of leukaemic subtype. Gene ontology analysis showed that cell lines chiefly overexpressed genes related to macromolecular metabolism, whereas in clinical samples genes related to the immune response were abundantly expressed. These findings must be taken into consideration when conclusions from cell line-based studies are extrapolated to patients.
Figures
Comment in
-
Leukaemia cell lines are robust in vitro models.Br J Haematol. 2008 Jul;142(1):137-8; author reply 138-41. doi: 10.1111/j.1365-2141.2008.07157.x. Epub 2008 Apr 28. Br J Haematol. 2008. PMID: 18445085 No abstract available.
References
-
- Beissbarth T, Speed TP. GOstat: find statistically overrepresented gene ontologies within a group of genes. Bioinformatics. 2004;20:1464–1465. - PubMed
-
- Bell LA, Ryan KM. Life and death decisions by E2F-1. Cell Death and Differentiation. 2004;11:137–142. - PubMed
-
- Benjamini Y, Hochberg Y. Controlling the false discovery rate: a practical and powerful approach to multiple testing, controlling the false discovery rate: a practical and powerful approach to multiple testing. Journal of the Royal Statistical Society. 1995;B 57:289–300.
-
- Bolstad BM, Irizarry RA, Astrand M, Speed TP. A comparison of normalization methods for high density oligonucleotide array data based on variance and bias. Bioinformatics. 2003;19:185–193. - PubMed
-
- Gautier L, Cope L, Bolstad BM, Irizarry RA. Affy–analysis of Affymetrix GeneChip data at the probe level. Bioinformatics. 2004;20:307–315. - PubMed
Publication types
MeSH terms
LinkOut - more resources
Full Text Sources
Other Literature Sources
Medical
