

Eukaryotic microbes, species recognition and the geographic limits of species: examples from the kingdom Fungi
- PMID: 17062413
- PMCID: PMC1764934
- DOI: 10.1098/rstb.2006.1923
Eukaryotic microbes, species recognition and the geographic limits of species: examples from the kingdom Fungi
Abstract
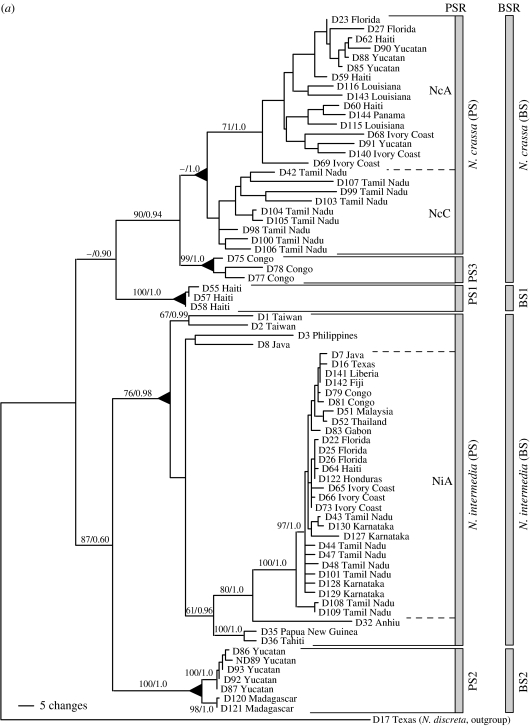
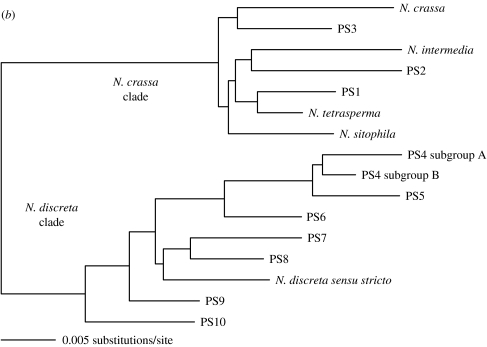
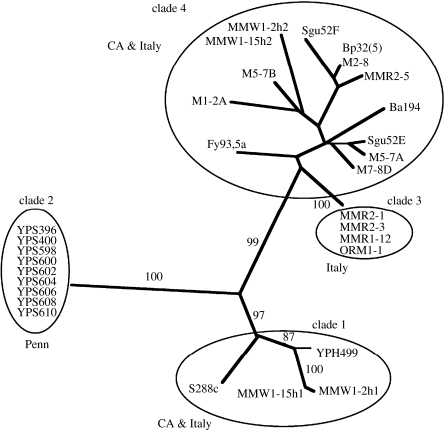
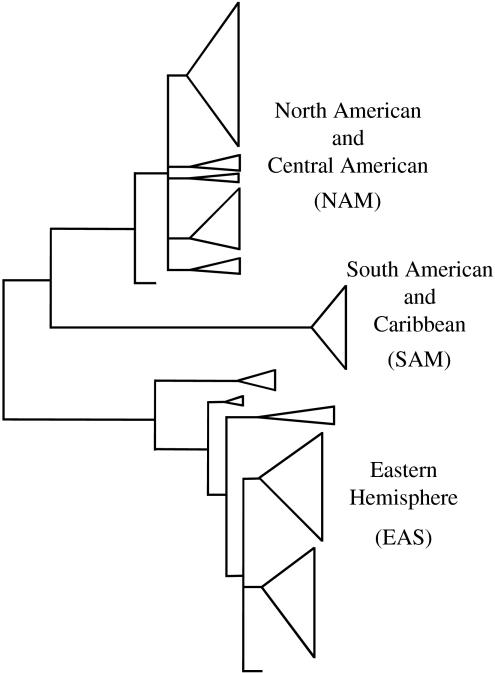
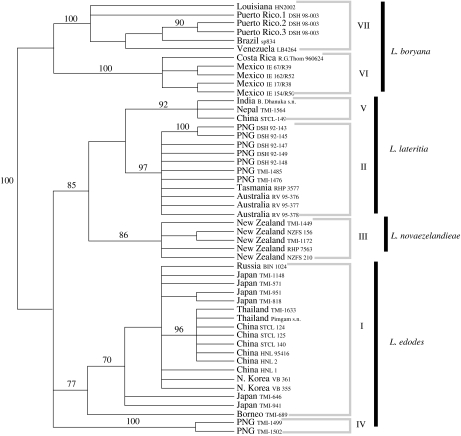
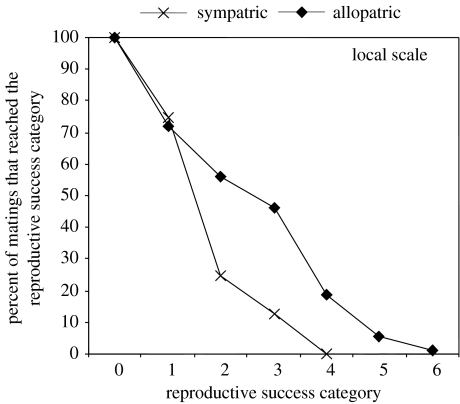
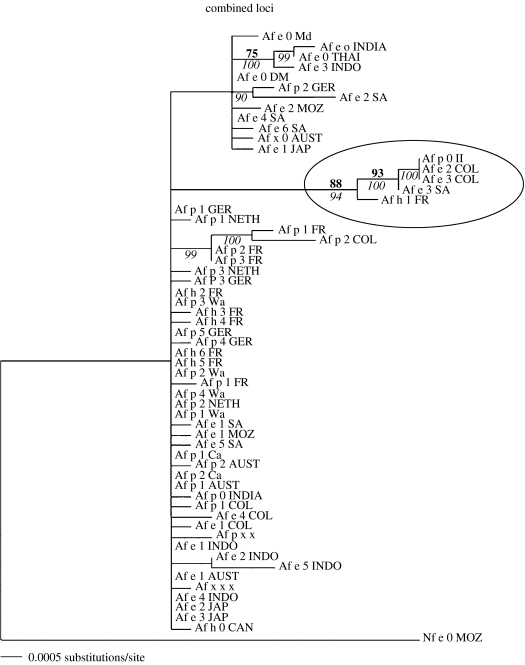
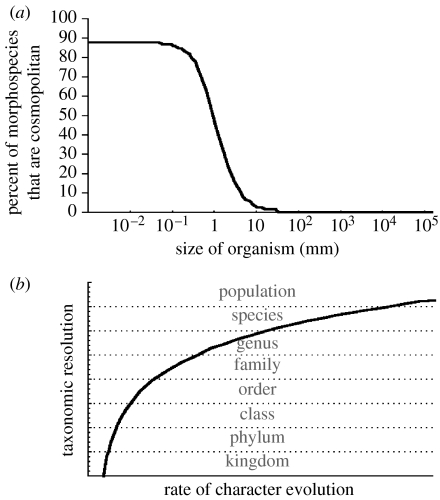
The claim that eukaryotic micro-organisms have global geographic ranges, constituting a significant departure from the situation with macro-organisms, has been supported by studies of morphological species from protistan kingdoms. Here, we examine this claim by reviewing examples from another kingdom of eukaryotic microbes, the Fungi. We show that inferred geographic range of a fungal species depends upon the method of species recognition. While some fungal species defined by morphology show global geographic ranges, when fungal species are defined by phylogenetic species recognition they are typically shown to harbour several to many endemic species. We advance two non-exclusive reasons to explain the perceived difference between the size of geographic ranges of microscopic and macroscopic eukaryotic species when morphological methods of species recognition are used. These reasons are that microbial organisms generally have fewer morphological characters, and that the rate of morphological change will be slower for organisms with less elaborate development and fewer cells. Both of these reasons result in fewer discriminatory morphological differences between recently diverged lineages. The rate of genetic change, moreover, is similar for both large and small organisms, which helps to explain why phylogenetic species of large and small organisms show a more similar distribution of geographic ranges. As a consequence of the different rates in fungi of genetic and morphological changes, genetic isolation precedes a recognizable morphological change. The final step in speciation, reproductive isolation, also follows genetic isolation and may precede morphological change.
Figures
Similar articles
-
The search for the fungal tree of life.Trends Microbiol. 2009 Nov;17(11):488-97. doi: 10.1016/j.tim.2009.08.001. Epub 2009 Sep 24. Trends Microbiol. 2009. PMID: 19782570 Review.
-
The measure of success: geographic isolation promotes diversification in Pachydactylus geckos.BMC Evol Biol. 2017 Jan 11;17(1):9. doi: 10.1186/s12862-016-0846-2. BMC Evol Biol. 2017. PMID: 28077086 Free PMC article.
-
Phylogeography and biogeography of fungi.Mycol Res. 2008 Apr;112(Pt 4):423-4. doi: 10.1016/j.mycres.2008.02.002. Epub 2008 Feb 21. Mycol Res. 2008. PMID: 18346884
-
Phylogenetic species recognition and species concepts in fungi.Fungal Genet Biol. 2000 Oct;31(1):21-32. doi: 10.1006/fgbi.2000.1228. Fungal Genet Biol. 2000. PMID: 11118132 Review.
-
Phylogenetic species recognition reveals host-specific lineages among poplar rust fungi.Mol Phylogenet Evol. 2013 Mar;66(3):628-44. doi: 10.1016/j.ympev.2012.10.021. Epub 2012 Nov 10. Mol Phylogenet Evol. 2013. PMID: 23147268
Cited by
-
Regional-Scale In-Depth Analysis of Soil Fungal Diversity Reveals Strong pH and Plant Species Effects in Northern Europe.Front Microbiol. 2020 Sep 4;11:1953. doi: 10.3389/fmicb.2020.01953. eCollection 2020. Front Microbiol. 2020. PMID: 33013735 Free PMC article.
-
Polytomy identification in microbial phylogenetic reconstruction.BMC Syst Biol. 2011;5 Suppl 3(Suppl 3):S2. doi: 10.1186/1752-0509-5-S3-S2. Epub 2011 Dec 23. BMC Syst Biol. 2011. PMID: 22784621 Free PMC article.
-
Evolutionary Perspectives on Human Fungal Pathogens.Cold Spring Harb Perspect Med. 2014 Nov 10;5(9):a019588. doi: 10.1101/cshperspect.a019588. Cold Spring Harb Perspect Med. 2014. PMID: 25384770 Free PMC article. Review.
-
Large-scale phylogenomic insights into the evolution of the Hymenochaetales.Mycology. 2024 Sep 17;16(2):617-634. doi: 10.1080/21501203.2024.2391527. eCollection 2025. Mycology. 2024. PMID: 40415915 Free PMC article.
-
Nematode spatial and ecological patterns from tropical and temperate rainforests.PLoS One. 2012;7(9):e44641. doi: 10.1371/journal.pone.0044641. Epub 2012 Sep 11. PLoS One. 2012. PMID: 22984536 Free PMC article.
References
-
- Aa, E., Townsend, J. P., Adams, R. I., Nielsen, K. M. & Taylor, J. W. 2006. Population structure and gene evolution in Saccharomyces cerevisiae FEMS Yeast Res.6, 702–715. (doi:10.1111/j.1567-1364.2006.00059.x) - DOI - PubMed
-
- Adam L, Ellwood S, Wilson I, Saenz G, Xiao S, Oliver R.P, Turner J.G, Somerville S. Comparison of Erysiphe cichoracearum and E. cruciferarum and a survey of 360 Arabidopsis thaliana accessions for resistance to these two powdery mildew pathogens. Mol. Plant Microbe Interact. 1999;12:1031–1043. - PubMed
-
- Anderson J.B, Ullrich R.C. Biological species of Armillaria mellea in North America. Mycologia. 1979;71:402–414.
-
- Anderson J.B, Korhonen K, Ullrich R.C. Relationships between European and North American biological species of Armillaria mellea. Exp. Mycol. 1980;4:87–95. doi:10.1016/0147-5975(80)90053-5 - DOI
-
- Avise J.C, Wollenberg K. Phylogenetics and the origin of species. Proc. Natl Acad. Sci. USA. 1997;94:7748–7755. doi:10.1073/pnas.94.15.7748 - DOI - PMC - PubMed
Publication types
MeSH terms
LinkOut - more resources
Full Text Sources
Medical
Research Materials
