. 2006;34(20):5815-28.
doi: 10.1093/nar/gkl703. Epub 2006 Oct 24.

Alterations to the expression level of mitochondrial transcription factor A, TFAM, modify the mode of mitochondrial DNA replication in cultured human cells

Affiliations

Alterations to the expression level of mitochondrial transcription factor A, TFAM, modify the mode of mitochondrial DNA replication in cultured human cells

Jaakko L O Pohjoismäki et al. Nucleic Acids Res. 2006.

Abstract

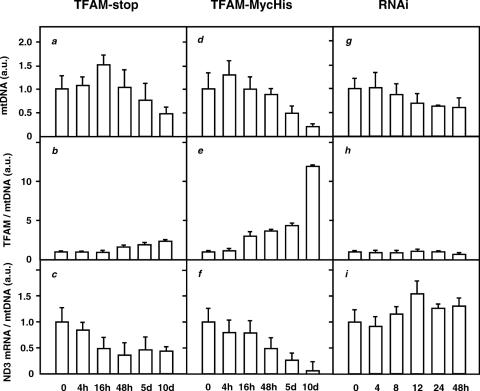
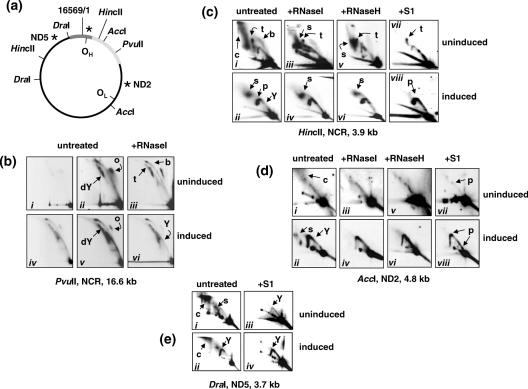
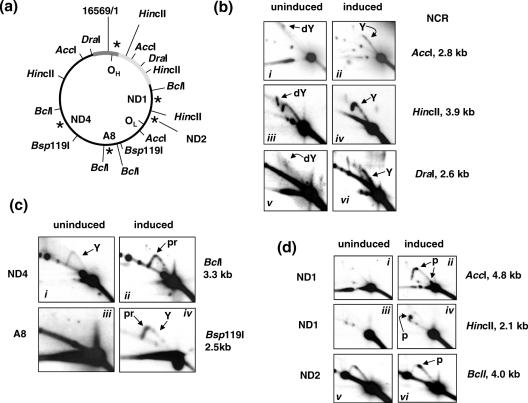
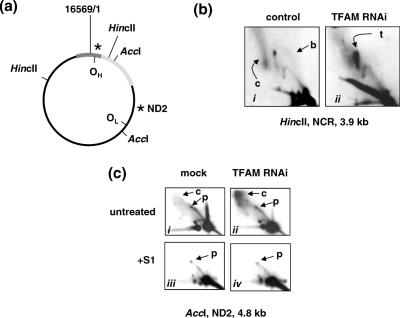
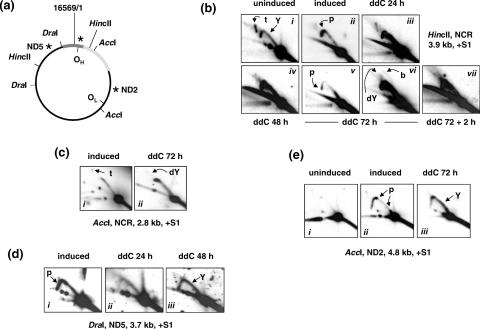
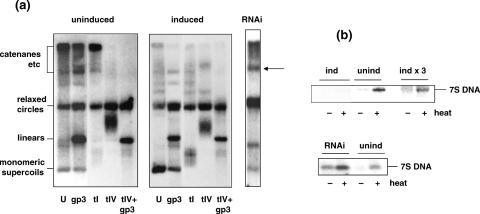
Mitochondrial transcription factor A (TFAM) is an abundant mitochondrial protein of the HMG superfamily, with various putative roles in mitochondrial DNA (mtDNA) metabolism. In this study we have investigated the effects on mtDNA replication of manipulating TFAM expression in cultured human cells. Mammalian mtDNA replication intermediates (RIs) fall into two classes, whose mechanistic relationship is not properly understood. One class is characterized by extensive RNA incorporation on the lagging strand, whereas the other has the structure of products of conventional, strand-coupled replication. TFAM overexpression increased the overall abundance of RIs and shifted them substantially towards those of the conventional, strand-coupled type. The shift was most pronounced in the rDNA region and at various replication pause sites and was accompanied by a drop in the relative amount of replication-termination intermediates, a substantial reduction in mitochondrial transcripts, mtDNA decatenation and progressive copy number depletion. TFAM overexpression could be partially phenocopied by treatment of cells with dideoxycytidine, suggesting that its effects are partially attributable to a decreased rate of fork progression. TFAM knockdown also resulted in mtDNA depletion, but RIs remained mainly of the ribosubstituted type, although termination intermediates were enhanced. We propose that TFAM influences the mode of mtDNA replication via its combined effects on different aspects of mtDNA metabolism.


Figures

Figure 1
Figure 1
Effects of induced expression of TFAM-stop and TFAM-MycHis and of RNAi knockdown of TFAM expression. Mitochondrial proteins, DNA and RNA were analysed from Flp-In™ T-Rex™ -293 cells stably transfected with the TFAM-stop (a–c) or TFAM-MycHis construct (d–f), induced over the times indicated or from HEK293T cells (g–i) following transfection with siRNAs Si2 and Si4 over the times indicated. In each case, error bars indicate means ± SEs from at least three independent experiments. a.u., arbitrary units. Measurements of mtDNA levels (a, d and g) are arbitrarily normalized to the mean values for uninduced or untreated cells. For cells under TFAM induction, the measurements were made by two independent methods, Southern blotting and Q-PCR and the values plotted for each time point are the means of measurements by the two methods, shown in Supplementary Figures 1 and 2. (b, e and h) show TFAM protein levels normalized to the mtDNA levels shown in (a, d and g), then normalized against the level in uninduced or untreated cells. (c, f and i) show ND3 mRNA levels normalized first against the 5S rRNA loading control, then against the mtDNA levels shown in (a, d and g), then finally against the level in uninduced or untreated cells. Samples of the raw data and compiled data for TFAM protein, mtDNA and RNA levels on which this figure is based, are shown in Supplementary Figures 1–3.
Figure 2
Figure 2
2DNAGE analysis of mtDNA replication intermediates (RIs) in cells induced to overexpress TFAM-stop. (a) Diagrammatic map of human mtDNA, showing the origins of heavy- (OH) and light-strand (OL) replication according to the orthodox model, relevant restriction sites and probes for the three regions of the genome analysed (approximate location of probes indicated by asterisks). NCR shown as dark grey bar, rDNA as pale grey bar. (be) 2DNAGE of mtDNA from uninduced cells and from cells induced to express TFAM-stop for 48 h, analysed using the restriction digests and probes indicated, with or without additional enzymatic treatments as shown. In each panel, the various arcs and other salient features are denoted as follows: Y, standard Y arcs, dY, standard doubleY arcs, c, ‘cloud’ of RNase-sensitive material, o, circular molecules, b, standard bubble arcs, s, slow-moving Y-like arcs, sensitive to various nucleases, t, termination intermediates lying on a portion of a standard X arc, p, prominent pause sites. See Supplementary Figure 5 for diagrammatic interpretations of the various arcs. Panels i and iv of part (b) and panels iii and iv of part (c) are equivalent exposures, for comparison. Other panels of uninduced cell mtDNA are 5- to 10-fold more exposed than induced cell material, in order to reveal the main features of the arcs. Note the general enhancement of RIs, relative loss of nuclease-sensitive species, of termination intermediates and of bubble arcs, following TFAM induction. The appearance of a complete or almost complete, Y arc in Figure 2b, panels iv–vi, is consistent with frequent strand breakage at OH or with recombinational strand-switching (also generating a free end at OH) or with frequent initiation far distant from the NCR.
Figure 3
Figure 3
2DNAGE analysis of S1 nuclease-resistant mtDNA RIs in cells induced to overexpress TFAM-stop. (a) Diagrammatic map of human mtDNA, nomenclature as for Figure 2a. (bd) 2DNAGE of mtDNA from uninduced cells and from cells induced to express TFAM-stop for 48 h, analysed using the restriction digests and probes indicated. All samples were treated with S1 nuclease before electrophoresis. Nomenclature as for Figure 2, plus pr, pause region (replication slow-zone). See Supplementary Figure 5 for diagrammatic interpretations. Comparable exposures are shown, to illustrate the general enhancement of S1-resistant RIs, the strengthening of pause sites and regions and the decrease in termination intermediates. Note that bubble arcs are not visible at these exposures following S1 nuclease treatment.
Figure 4
Figure 4
2DNAGE analysis mtDNA RIs in cells treated with TFAM-specific siRNAs. (a) Diagrammatic map of human mtDNA, nomenclature as for Figure 2a. (b) and (c) 2DNAGE of mtDNA from control (or mock-transfected) cells and from cells treated with TFAM siRNAs for 24 h, using the restriction digests and probes indicated, with or without additional S1 nuclease treatment as shown. Nomenclature as for Figure 2. See Supplementary Figure 5 for diagrammatic interpretations. Comparable exposures are shown, to illustrate the general enhancement of termination intermediates and of the cloud of nuclease-sensitive material migrating at high molecular weight.
Figure 5
Figure 5
2DNAGE analysis of RIs in cells induced to overexpress TFAM-stop or treated with ddC. (a) Diagrammatic map of human mtDNA, nomenclature as for Figure 2a. (be) 2DNAGE of mtDNA from uninduced cells, cells induced to express TFAM-stop for 48 h or HEK293T cells treated with ddC for the indicated times (72 + 2 h meaning 72 h of treatment followed by 2 h of recovery in fresh medium). Restriction digests and probes as indicated. All samples were treated with S1 nuclease before electrophoresis. Nomenclature as for Figure 2. See Supplementary Figure 5 for diagrammatic interpretations. Exposure times vary, as needed to reveal the main features of arcs of RIs. Note the similar effects of TFAM overexpression and ddC treatment: general enhancement of S1 nuclease-resistant RIs, suppression of termination intermediates. Panel vi of part (c) is a longer exposure of panel v.
Figure 6
Figure 6
Effects of TFAM overexpression and knockdown on mtDNA topology. One-dimensional agarose gel blots, hybridized with OH probe. (a) mtDNA from uninduced cells and from cells induced to overexpress TFAM-stop for 48 h, fractionated on a 0.4% agarose gel run in TBE. Only the high molecular weight portion of the gel is shown. Samples were either untreated (U) or treated with T7 gp3 endonuclease (gp3), topoisomerase I (tI), topoisomerase IV (tIV) or topoisomerase IV plus T7 gp3 endonuclease. Identity of the main topoisomers was inferred from enzymatic sensitivity and confirmed by other treatments (data not shown). DNA from cells treated with TFAM-specific siRNAs (RNAi) for 24 h was run on a separate gel. (b) MtDNA from TFAM-induced, uninduced and siRNA-treated cells, fractionated on 0.4% agarose gels run in TBE. Only the low molecular weight portion of each gel is shown. First 4 lanes of upper panel are equally exposed, whereas the right-most two lanes are ∼3-fold overloaded, to reveal the presence of 7S DNA in induced cells. Samples were either heated for 2 min at 95°C (+) or left unheated, as indicated.

References

    1. Clayton D.A. Replication of animal mitochondrial DNA. Cell. 1982;28:693–705. - PubMed
    1. Yang M.Y., Bowmaker M., Reyes A., Vergani L., Angeli P., Gringeri E., Jacobs H.T., Holt I.J. Biased incorporation of ribonucleotides on the mitochondrial L-strand accounts for apparent strand-asymmetric DNA replication. Cell. 2002;111:495–505. - PubMed
    1. Yasukawa T., Yang M.Y., Jacobs H.T., Holt I.J. A bidirectional origin of replication maps to the major noncoding region of human mitochondrial DNA. Mol. Cell. 2005;18:651–662. - PubMed
    1. Holt I.J., Lorimer H.E., Jacobs H.T. Coupled leading- and lagging-strand synthesis of mammalian mitochondrial DNA. Cell. 2000;100:515–524. - PubMed
    1. Bowmaker M., Yang M.Y., Yasukawa T., Reyes A., Jacobs H.T., Huberman J.A., Holt I.J. Mammalian mitochondrial DNA replicates bidirectionally from an initiation zone. J. Biol. Chem. 2003;278:50961–50969. - PubMed

Publication types

MeSH terms