. 2007 Feb 15;109(4):1620-6.
doi: 10.1182/blood-2006-03-013771. Epub 2006 Oct 24.

The antiapoptotic protein Mcl-1 is essential for the survival of neutrophils but not macrophages

Affiliations

The antiapoptotic protein Mcl-1 is essential for the survival of neutrophils but not macrophages

Ivan Dzhagalov et al. Blood. .

Abstract

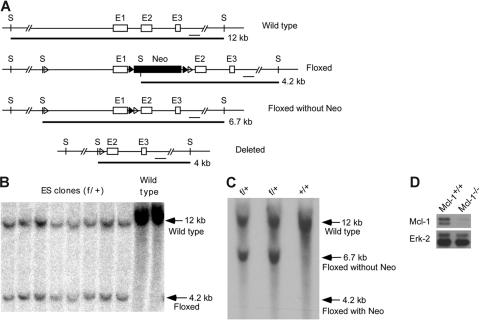
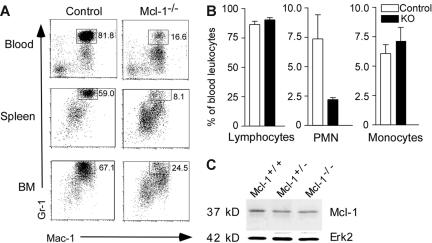
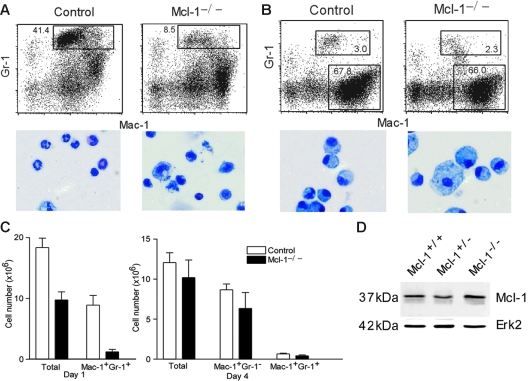
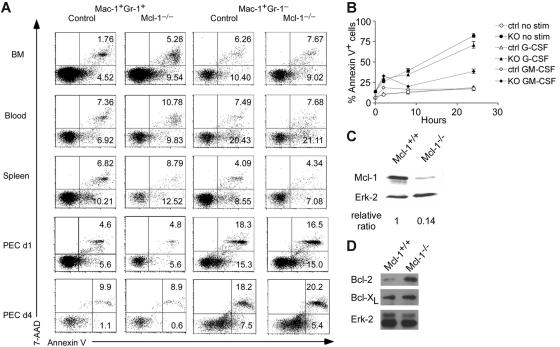
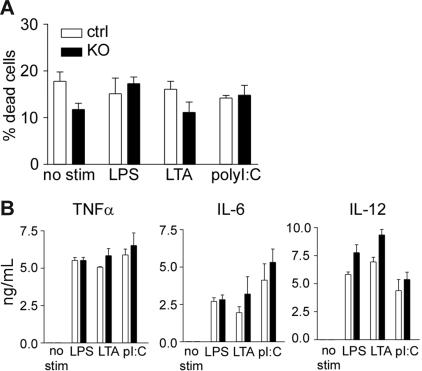
The antiapoptotic protein Mcl-1, a member of the Bcl-2 family, plays critical roles in promoting the survival of lymphocytes and hematopoietic stem cells. Although previous studies have implicated Mcl-1 in regulating the survival of neutrophils and macrophages, the in vivo function of Mcl-1 in these 2 cell lineages remained unclear. To address this, we have generated mice conditionally lacking Mcl-1 expression in neutrophils and macrophages. We show that Mcl-1 conditional knockout mice had a severe defect in neutrophil survival, whereas macrophage survival was normal. The granulocyte compartment in the blood, spleen, and bone marrow of Mcl-1 conditional knockout mice exhibited an approximately 2- to 3-fold higher apoptotic rate than control cells. In contrast, resting and activated macrophages from Mcl-1-deficient mice exhibited normal survival and contained up-regulated expression of Bcl-2 and Bcl-xL. These data suggest that Mcl-1 plays a nonredundant role in promoting the survival of neutrophils but not macrophages.


Figures

Figure 1
Figure 1
Generation of mice conditionally lacking Mcl-1 expression in neutrophils and macrophages. (A) Schematic of targeting strategy for Mcl-1 allele. E1, E2, and E3 are exons 1-3 of Mcl-1. S indicates SpeI site. The size of alleles digested by SpeI and the probe are shown. (B) Southern blot analysis of gDNA from homologously recombined ES clones and parental ES cells (wild type). gDNA was digested with SpeI and hybridized with probes shown in panel A. (C) Southern blot analysis of gDNA from the tails of Mcl-1f/+ mice after crossing with FLPeR mice. gDNA from wild-type mice (+/+) served as a control for the wild-type allele. (D) Expression of Mcl-1 in BM-derived macrophages. Macrophages derived from 1-week culture of BM from Mcl-1−/− and control mice in the presence of L929-conditioned medium were lysed for Western blot analysis. Erk expression serves as a loading control.
Figure 2
Figure 2
Impaired neutrophil development in Mcl-1–deficient mice. (A) FACS profiles of blood, spleen, and BM of Mcl-1−/− and control mice. Single-cell suspensions were stained with FITC–anti–Mac-1 and APC–anti–Gr-1 monoclonal antibodies. Shown are cells gated on granulocytes based on their forward and side scatter. Numbers indicate the percentage of cells in the gated regions. Data are representative of 3 independent experiments from a group of 9 mice. (B) Percents of lymphocytes, PMN cells, and monocytes in the blood of Mcl-1−/− and control mice. Blood smears were stained with Hema 3 and counted under light microscopy; n = 6 for each group. Data are mean + standard deviation. (C) Expression of Mcl-1 in purified BM neutrophils from Mcl-1−/− and control mice as determined by Western blot. Erk2 serves as a loading control. Data are representative of 2 experiments.
Figure 3
Figure 3
Impaired neutrophil but not macrophage influx in peritonitis. (A) FACS analysis of day 1 peritoneal cells. Peritoneal cells were stained with FITC–anti–Mac-1 and APC–anti–Gr-1. Numbers indicate the percentages of cells in the gated regions. Also shown are cytospin images of peritoneal cells from Mcl-1−/− and control mice. (B) FACS analysis and cytospin images of day 4 peritoneal cells. (C) Numbers of total peritoneal cells, neutrophils, and macrophages at day 1 and day 4 after thioglycollate injection. The numbers of Mac-1+Gr-1+ and Mac-1+Gr-1 cells were calculated by multiplying the percents of cells with the total numbers (n = 6). Data shown are mean + standard deviation. (D) Expression of Mcl-1 in purified peritoneal neutrophils from Mcl-1−/− and control mice as determined by Western blot. Erk2 serves as a loading control. Data are representative of 2 experiments.
Figure 4
Figure 4
Enhanced apoptosis in Mcl-1−/− neutrophils. (A) Detection of apoptosis in granulocytes and macrophages of Mcl-1−/− mice. Apoptosis was detected by double staining of 7-AAD and annexin V. Mac-1+Gr-1+ and Mac-1+Gr-1 cells from BM, blood, spleen, and peritoneal cavity day 1 and day 4 after thioglycollate injection (PEC d1, d4) were gated for 7-AAD and annexin V staining. Numbers indicate percents in each region. The results are representative of 6 independent experiments from 12 mice. (B) Apoptosis rates of Mcl-1–deficient BM neutrophils with or without growth factor stimulation. BM cells from Mcl-1–deficient (KO) and control mice were stimulated with G-CSF or GM-CSF for different periods of time in triplicates. Mac-1+Gr-1+ cells were examined for apoptosis by flow cytometry. The graph shows the mean and standard deviation of the percentage of apoptotic and dead cells as defined by annexin V+. The results are representative of 3 independent experiments. (C) Mcl-1 expression in purified BM neutrophils treated with 10 ng/mL GM-CSF for 24 hours. Relative protein expression was normalized to Erk-2 expression levels. (D) Western blot analysis of Bcl-2 and Bcl-xL expression in Mcl-1−/− macrophages. BM macrophages were lysed and blotted with anti–Bcl-2 and Bcl-xL antibodies as shown in Figure 1D.
Figure 5
Figure 5
Normal macrophage survival and cytokine production on TLR stimulation. (A) Apoptosis rate of Mcl-1–deficient macrophages with or without PAMP stimulation. Peritoneal macrophages from Mcl-1–deficient (KO) and control mice (ctrl) were stimulated with the indicated PAMPs for 16 hours and examined for apoptosis using the LIVE/DEAD Viability/Cytotoxicity kit. (B) Inflammatory cytokine production by Mcl-1–deficient macrophages after PAMP stimulation. Peritoneal macrophages from Mcl-1–deficient (■)and control (□)mice were stimulated with the indicated PAMPs overnight and measured for cytokine productions by ELISA. Shown are mean and SD of triplicate determinations. Data are representative of 3 experiments.

References

    1. Marsden VS, Strasser A. Control of apoptosis in the immune system: Bcl-2, BH3-only proteins and more. Annu Rev Immunol. 2003;21:71–105. - PubMed
    1. Zhang N, Hartig H, Dzhagalov I, Draper D, He YW. The role of apoptosis in the development and function of T lymphocytes. Cell Res. 2005;15:749–769. - PubMed
    1. Kozopas KM, Yang T, Buchan HL, Zhou P, Craig RW. MCL1, a gene expressed in programmed myeloid cell differentiation, has sequence similarity to BCL2. Proc Natl Acad Sci U S A. 1993;90:3516–3520. - PMC - PubMed
    1. Hsu SY, Lin P, Hsueh AJ. BOD (Bcl-2-related ovarian death gene) is an ovarian BH3 do-main-containing proapoptotic Bcl-2 protein capable of dimerization with diverse antiapoptotic Bcl-2 members. Mol Endocrinol. 1998;12:1432–1440. - PubMed
    1. Cuconati A, Mukherjee C, Perez D, White E. DNA damage response and MCL-1 destruction initiate apoptosis in adenovirus-infected cells. Genes Dev. 2003;17:2922–2932. - PMC - PubMed

Publication types