

Folding transition-state and denatured-state ensembles of FSD-1 from folding and unfolding simulations
- PMID: 17064170
- PMCID: PMC3382983
- DOI: 10.1021/jp063716a
Folding transition-state and denatured-state ensembles of FSD-1 from folding and unfolding simulations
Abstract
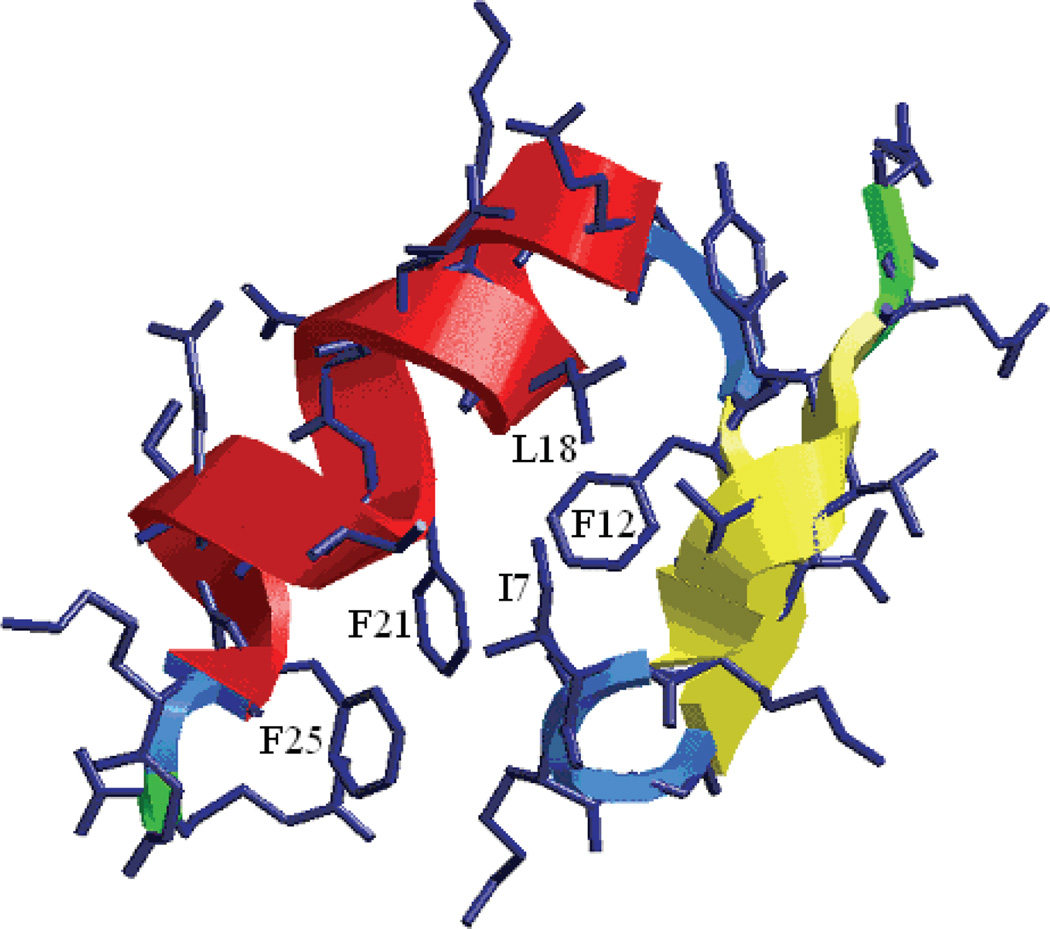
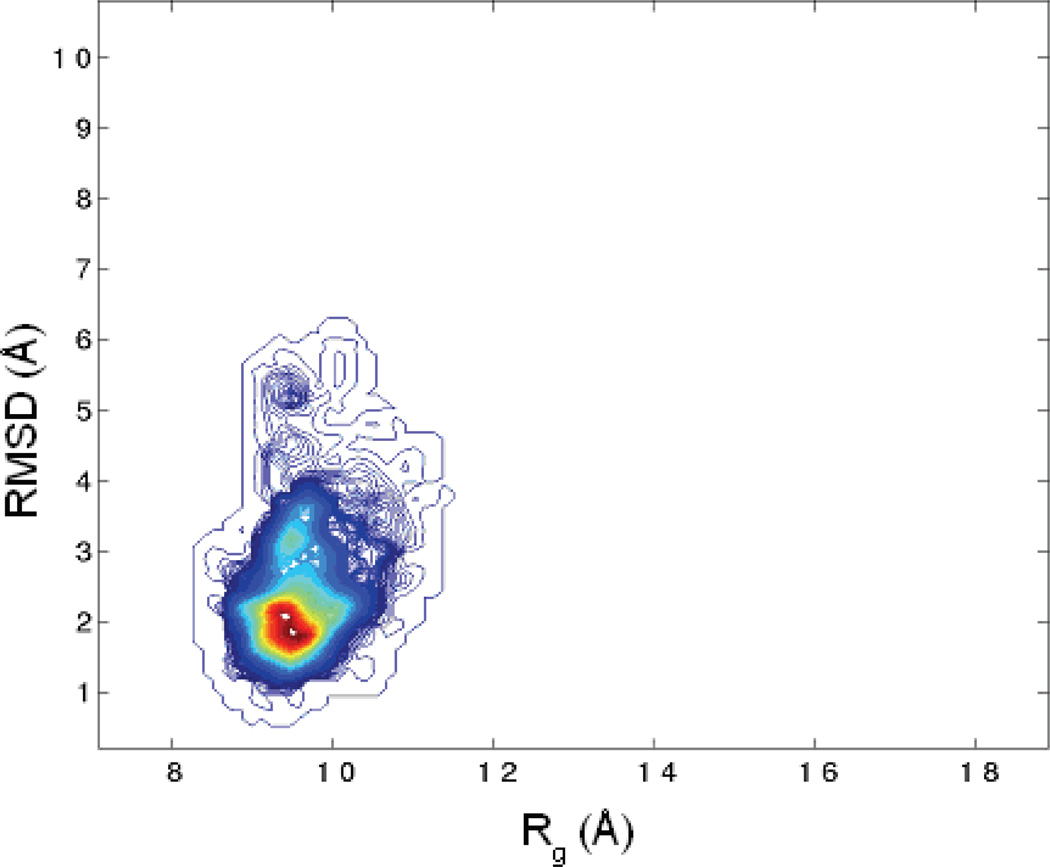
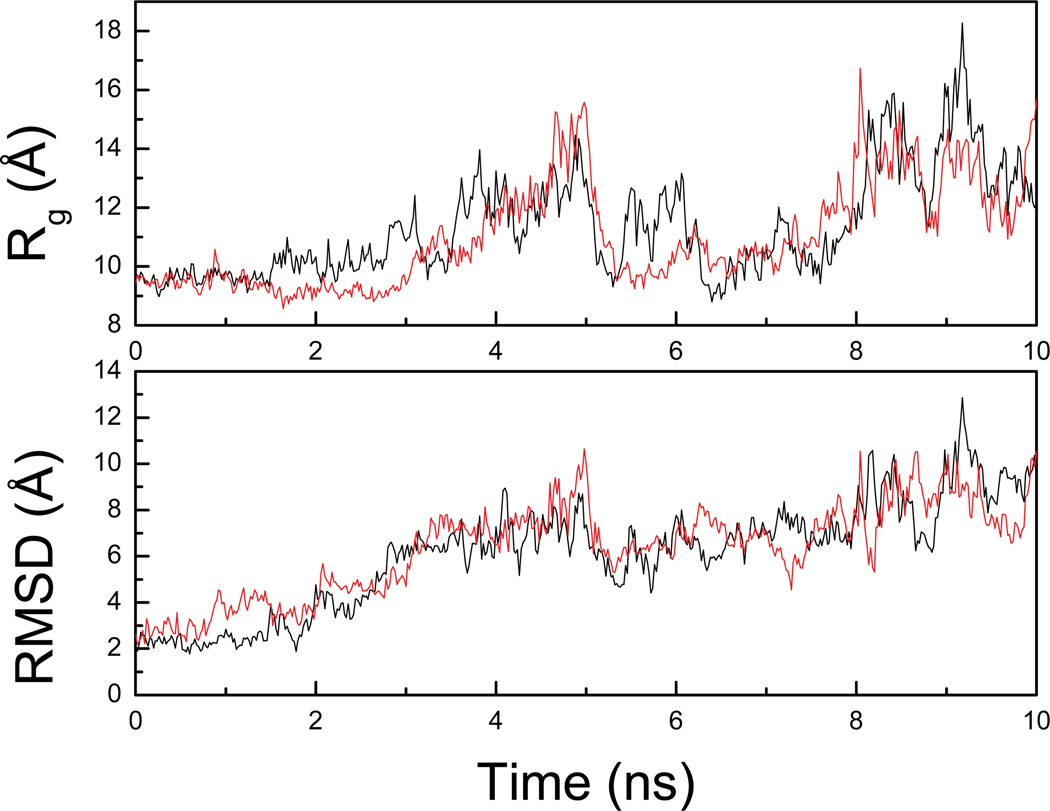
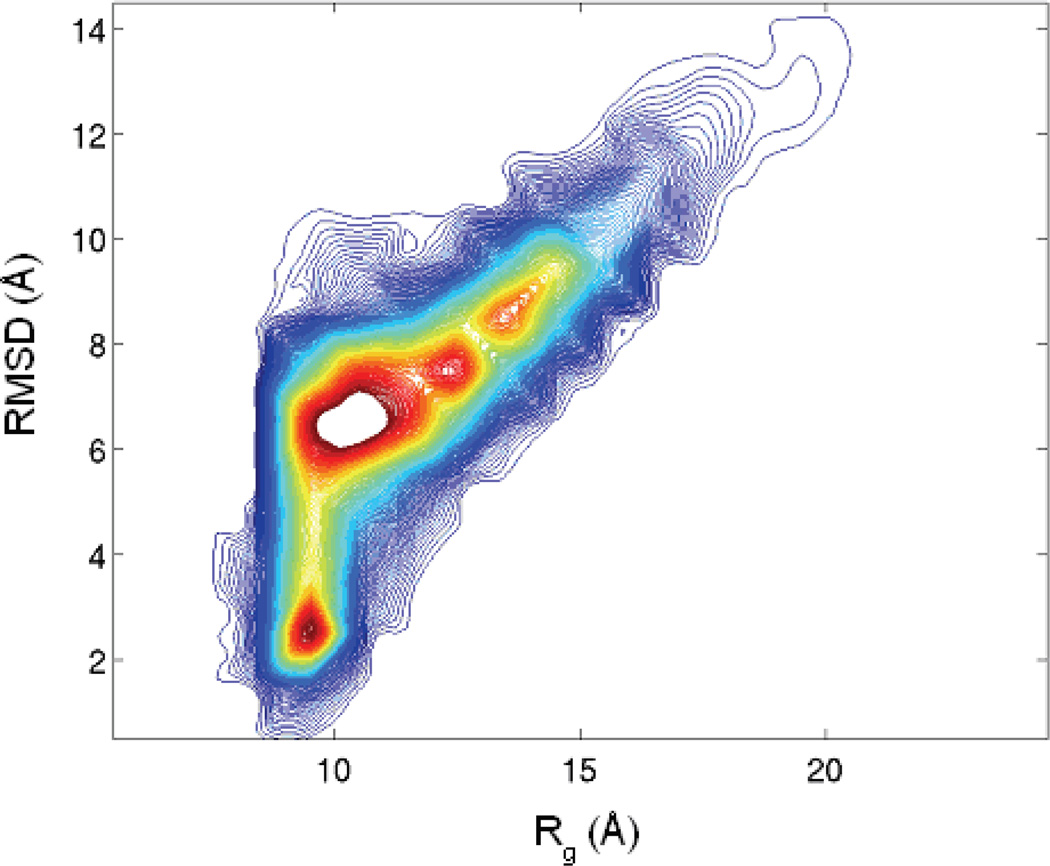
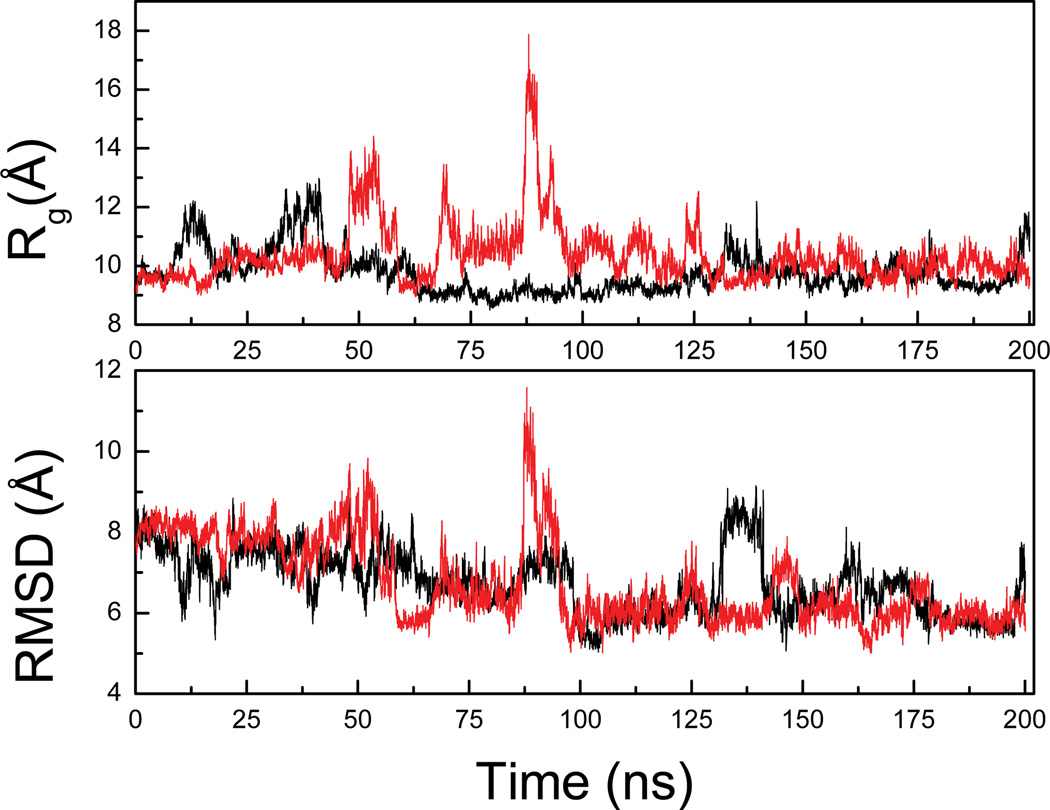
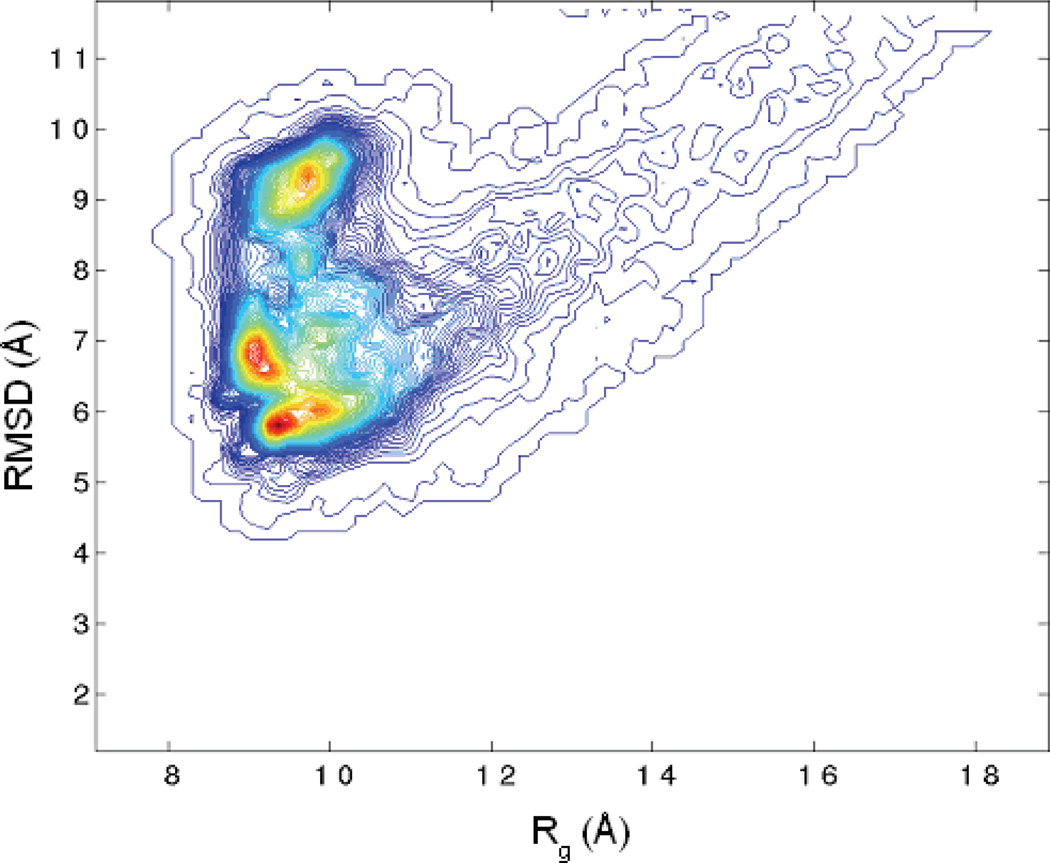
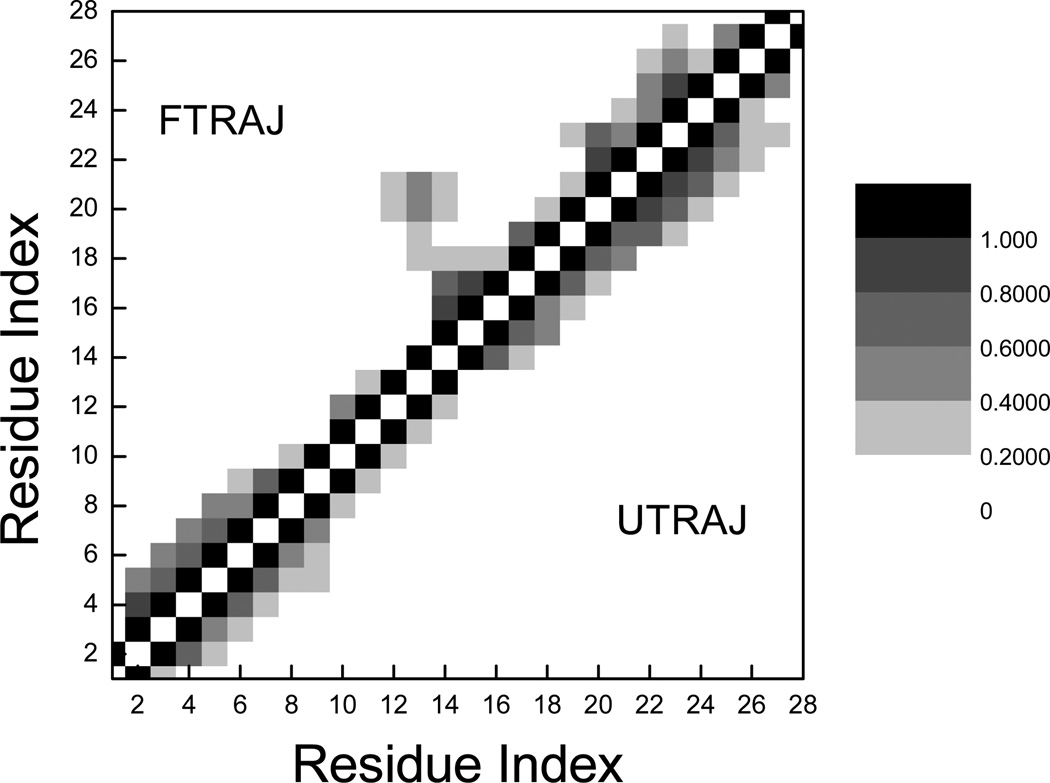
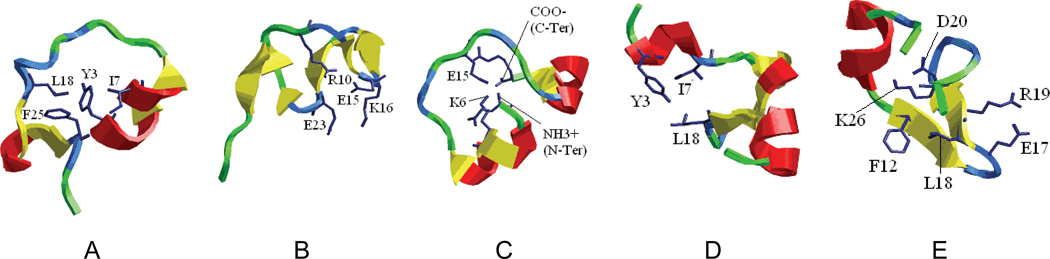
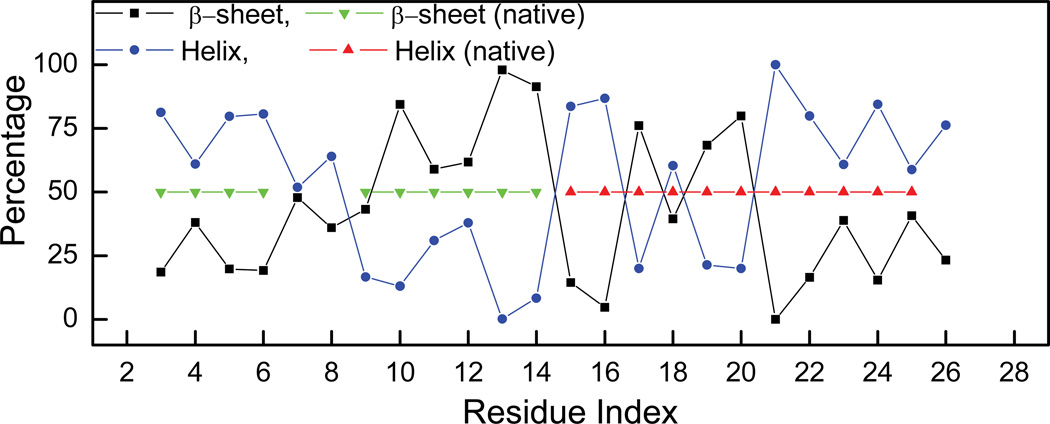
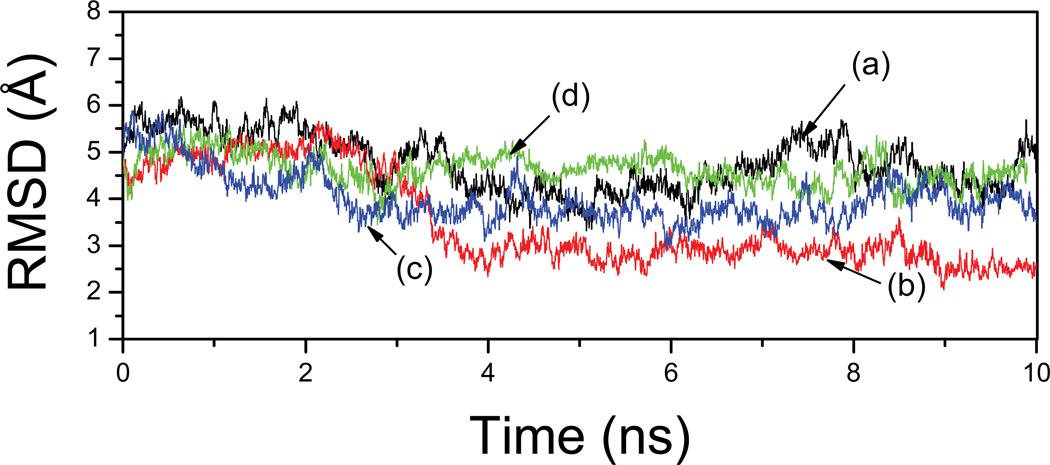
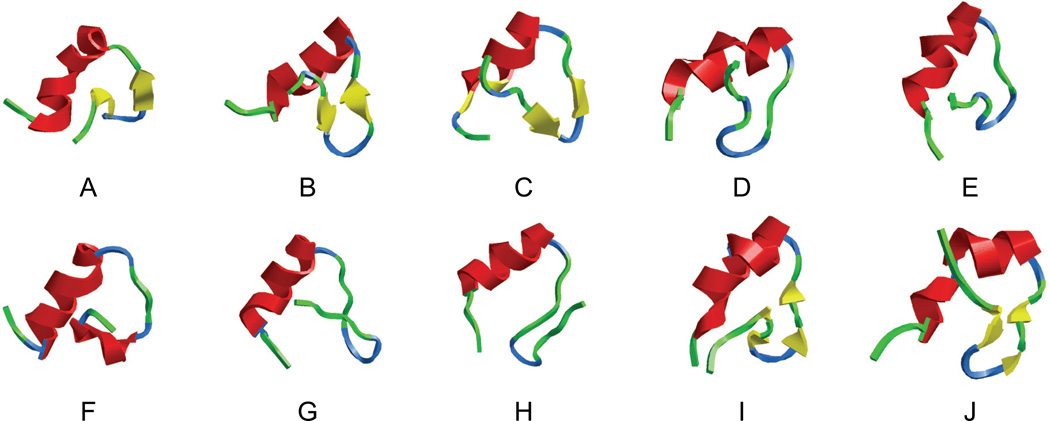
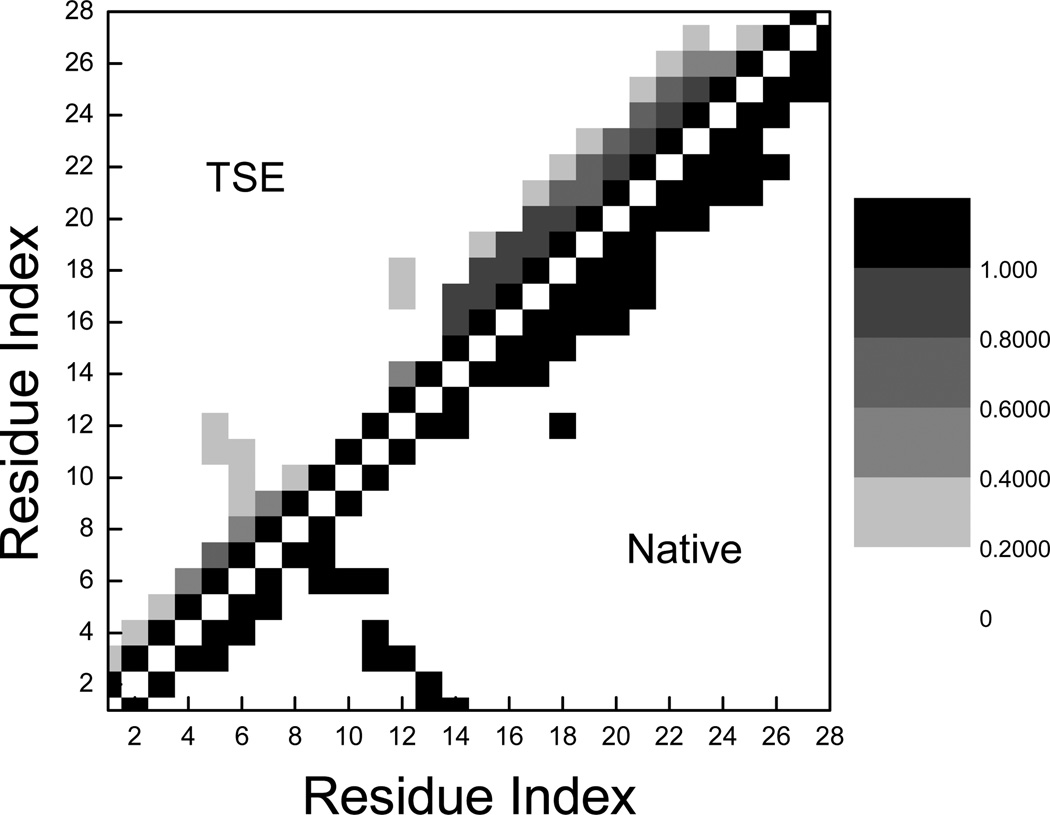
Characterization of the folding transition-state ensemble and the denatured-state ensemble is an important step toward a full elucidation of protein folding mechanisms. We report herein an investigation of the free-energy landscape of FSD-1 protein by a total of four sets of folding and unfolding molecular dynamics simulations with explicit solvent. The transition-state ensemble was initially identified from unfolding simulations at 500 K and was verified by simulations at 300 K starting from the ensemble structures. The denatured-state ensemble and the early-stage folding were studied by a combination of unfolding simulations at 500 K and folding simulations at 300 K starting from the extended conformation. A common feature of the transition-state ensemble was the substantial formation of the native secondary structures, including both the alpha-helix and beta-sheet, with partial exposure of the hydrophobic core in the solvent. Both the native and non-native secondary structures were observed in the denatured-state ensemble and early-stage folding, consistent with the smooth experimental melting curve. Interestingly, the contact orders of the transition-state ensemble structures were similar to that of the native structure and were notably lower than those of the compact structures found in early-stage folding, implying that chain and topological entropy might play significant roles in protein folding. Implications for FSD-1 folding mechanisms and the rate-limiting step are discussed. Analyses further revealed interesting non-native interactions in the denatured-state ensemble and early-stage folding and the possibility that destabilization of these interactions could help to enhance the stability and folding rate of the protein.
Figures
References
-
- Lindorff-Larsen K, Rogen P, Paci E, Vendruscolo M, Dobson CM. Trends Biochem Sci. 2005;30:13. - PubMed
-
- Vendruscolo M, Dokholyan NV, Paci E, Karplus M. Phys Rev E Stat Nonlin Soft Matter Phys. 2002;65:061910. - PubMed
-
- Day R, Bennion BJ, Ham S, Daggett V. J Mol Biol. 2002;322:189. - PubMed
-
- Li A, Daggett V. J Mol Biol. 1996;257:412. - PubMed
Publication types
MeSH terms
Substances
Grants and funding
LinkOut - more resources
Full Text Sources
