. 2007 Jan;81(2):599-612.
doi: 10.1128/JVI.01739-06. Epub 2006 Oct 25.

Mechanisms of gastrointestinal CD4+ T-cell depletion during acute and early human immunodeficiency virus type 1 infection

Affiliations

Mechanisms of gastrointestinal CD4+ T-cell depletion during acute and early human immunodeficiency virus type 1 infection

Saurabh Mehandru et al. J Virol. 2007 Jan.

Abstract

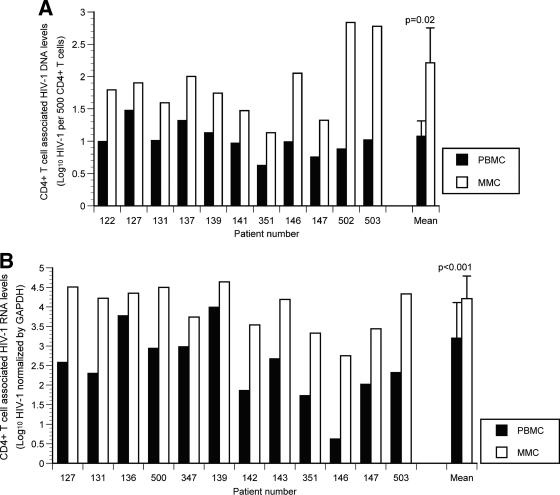
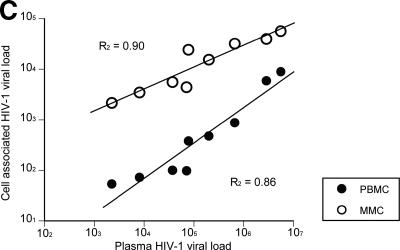
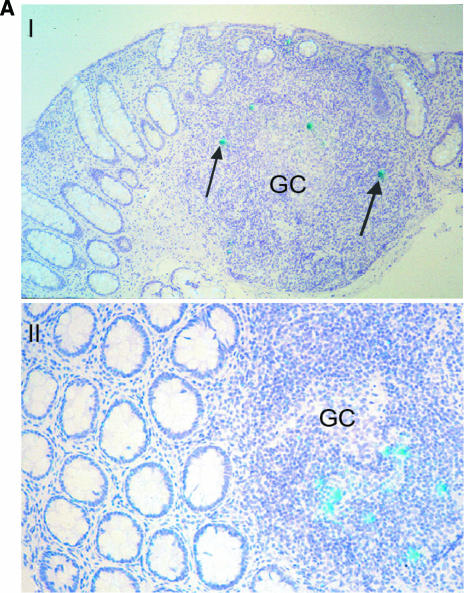
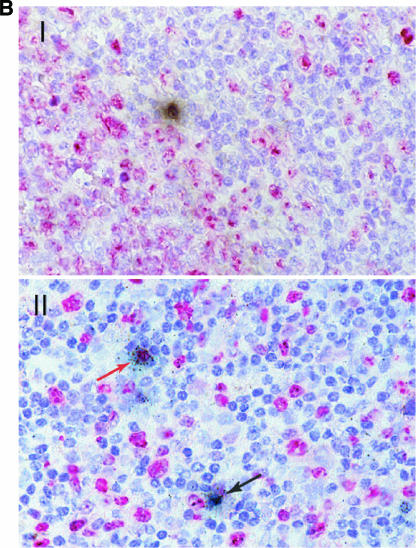
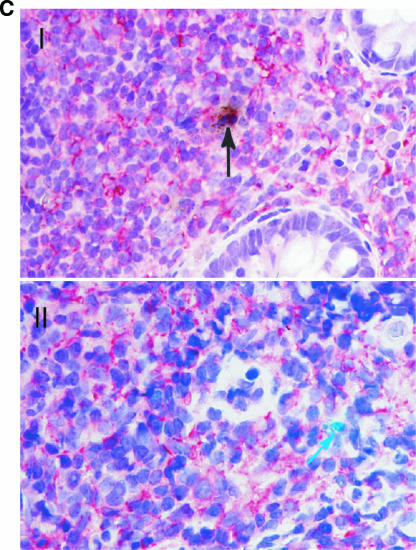
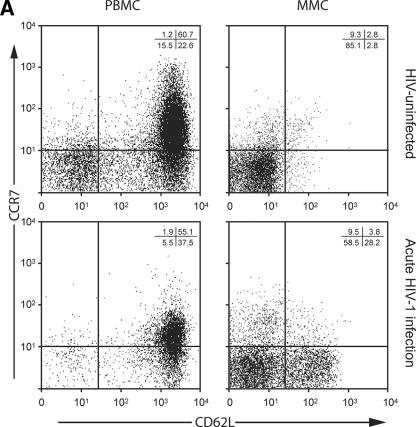
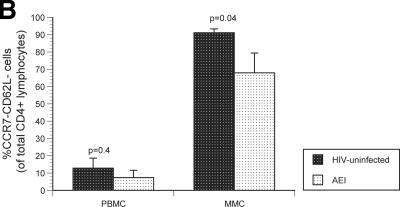
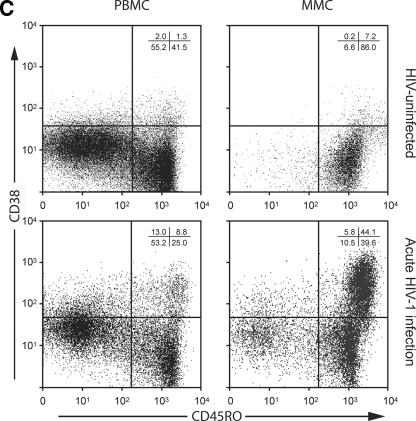
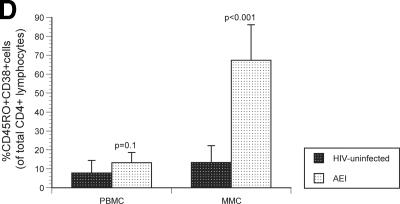
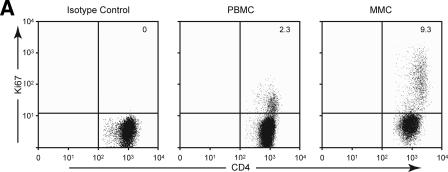
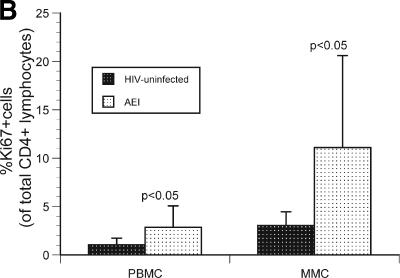
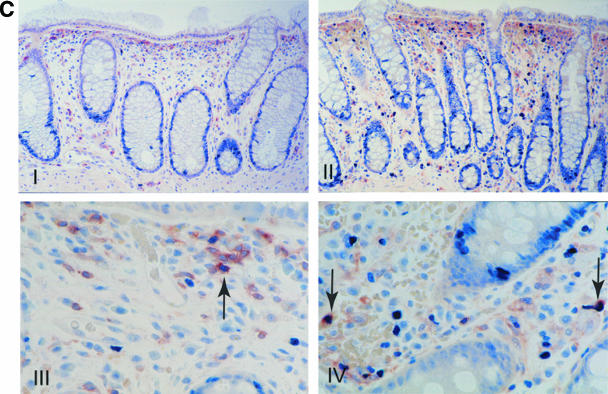
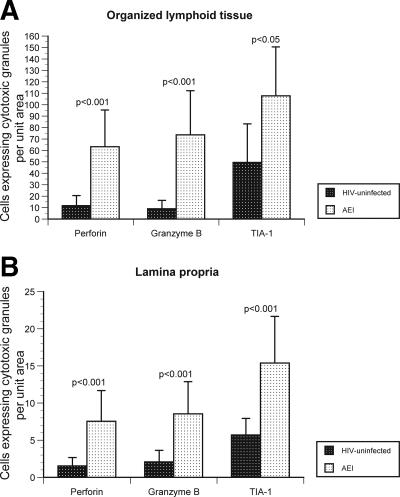
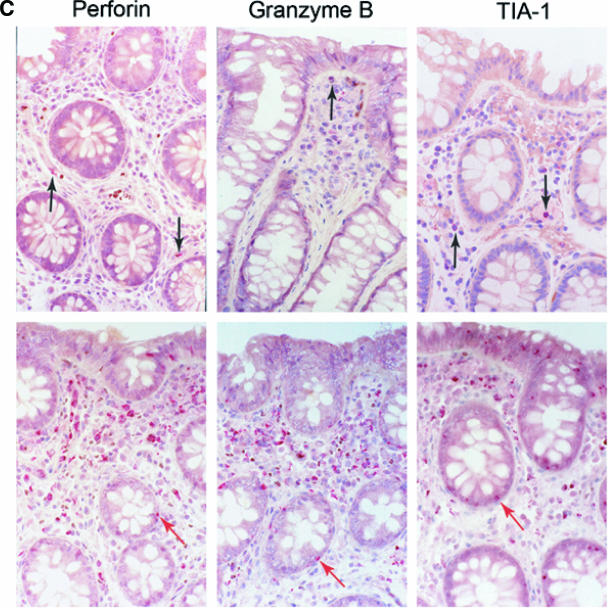
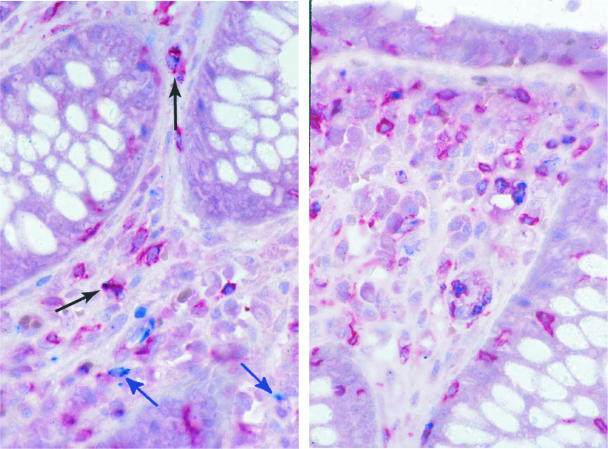
During acute and early human immunodeficiency virus type 1 (HIV-1) infection (AEI) more than 50% of CD4+ T cells are preferentially depleted from the gastrointestinal (GI) lamina propria. To better understand the underlying mechanisms, we studied virological and immunological events within the peripheral blood (PB) and GI tract during AEI. A total of 32 AEI subjects and 18 uninfected controls underwent colonic biopsy. HIV-1 viral DNA and RNA levels were quantified in CD4+ T cells derived from the GI tract and PB by using real-time PCR. The phenotype of infected cells was characterized by using combinations of immunohistochemistry and in situ hybridization. Markers of immunological memory, activation, and proliferation were examined by flow cytometry and immunohistochemistry, and the host-derived cytotoxic cellular response was examined by using immunohistochemistry. GI CD4+ T cells harbored, on average, 13-fold higher HIV-1 viral DNA levels and 10-fold higher HIV-1 RNA levels than PB CD4+ T cells during AEI. HIV-1 RNA was detected in both "activated" and "nonactivated" mucosal CD4+ T cells. A significantly higher number of activated and proliferating T cells were detected in the GI tract compared to the PB, and a robust cytotoxic response (HIV-1 specificity not determined) was detected in the GI tract as early as 18 days postinfection. Mucosal CD4+ T-cell depletion is multifactorial. Direct viral infection likely accounts for the earliest loss of CD4+ T cells. Subsequently, ongoing infection of susceptible CD4+ T cells, along with activation-induced cellular death and host cytotoxic cellular response, are responsible for the persistence of the lesion.


Figures

FIG. 1.
FIG. 1.
Gastrointestinal CD4+ T cells harbor a greater viral burden than PB CD4+ T cells during acute and early HIV-1 infection. PBMC and MMCs from subjects with acute and early HIV-1 infection were flow cytometrically sorted with >99.5% purity. HIV-1 viral DNA and RNA levels were quantified and compared between GI and PB CD4+ T cells. (A) The log10 HIV-1 viral DNA copy number per 500 CD4+ T cells (shown on the y axis) is compared in 11 study subjects (depicted on the x axis) with black bars representing the PBMC and white bars representing the MMCs. (B) The log10 HIV-1 RNA levels normalized by GAPDH signal (shown on the y axis) are compared in 12 study subjects (represented on the x axis) with black bars depicting the PBMC and white bars depicting the MMCs. (C) Levels of plasma HIV-1 viral load (represented on the x axis) are compared to the PBMC (gray circles) and MMC (white circles) associated viral load (shown on the y axis).
FIG. 1.
FIG. 1.
Gastrointestinal CD4+ T cells harbor a greater viral burden than PB CD4+ T cells during acute and early HIV-1 infection. PBMC and MMCs from subjects with acute and early HIV-1 infection were flow cytometrically sorted with >99.5% purity. HIV-1 viral DNA and RNA levels were quantified and compared between GI and PB CD4+ T cells. (A) The log10 HIV-1 viral DNA copy number per 500 CD4+ T cells (shown on the y axis) is compared in 11 study subjects (depicted on the x axis) with black bars representing the PBMC and white bars representing the MMCs. (B) The log10 HIV-1 RNA levels normalized by GAPDH signal (shown on the y axis) are compared in 12 study subjects (represented on the x axis) with black bars depicting the PBMC and white bars depicting the MMCs. (C) Levels of plasma HIV-1 viral load (represented on the x axis) are compared to the PBMC (gray circles) and MMC (white circles) associated viral load (shown on the y axis).
FIG. 2.
FIG. 2.
Detection of HIV-1 RNA in the GI tract during acute and early HIV-1 infection and characterization of the phenotype of infected GI lymphocytes. Using a 35S-labeled, single-stranded antisense RNA probe of HIV-1, in situ hybridization was performed on paraffin sections to detect HIV-1 RNA within the GI tract. Combinations of immunohistochemistry and in situ hybridization were used to determine whether infected lymphocytes exhibited a proliferating (Ki67+) or activated (HLA-DR+) phenotype. Cells were considered positive for viral gene expression if the grain count was more than six times the background. (A) In the upper panel, follicular localization of HIV-1 mRNA (blue-green, using reflected light) is indicated by black arrows at (estimated) day 18 postinfection (subject 503). Original magnification, ×50. The lower panel depicts a higher magnification (×100) of a biopsy from subject 131 at (estimated) 25 days postinfection. Scattered HIV-1-infected cells are noted in the lymphoid follicle (blue-green, reflected light), along with delicate viral trapping (faint, reticular green in subject 131). Virus trapping could not be detected in the germinal center (GC) in subject 503 at day 18 postinfection. (B) HIV gene expression (black, using transmitted light) in proliferating (MIB-1/Ki67+; red) and nonproliferating cells. Panel I shows the edge of a germinal center (GC, subject 503, 18 days postinfection) with the RNA-producing, Ki67+ cell. Panel II depicts the extrafollicular lymphoid tissue (subject 502, 19 days postinfection) showing a Ki67+ cell with low grain count (red arrow) and a Ki67 cell with a high grain count (black arrow). Original magnification, ×100. (C) Panel I shows an HLA-DR (red)-expressing cell containing HIV-1 RNA (black, transmitted light). A sample from subject 502 at (estimated) 19 days postinfection is shown. Original magnification, ×100. Panel II depicts the same study subject. The HIV-1 RNA+ cell (blue-green signal, reflected light) does not express HLA-DR. Original magnification, ×100.
FIG. 2.
FIG. 2.
Detection of HIV-1 RNA in the GI tract during acute and early HIV-1 infection and characterization of the phenotype of infected GI lymphocytes. Using a 35S-labeled, single-stranded antisense RNA probe of HIV-1, in situ hybridization was performed on paraffin sections to detect HIV-1 RNA within the GI tract. Combinations of immunohistochemistry and in situ hybridization were used to determine whether infected lymphocytes exhibited a proliferating (Ki67+) or activated (HLA-DR+) phenotype. Cells were considered positive for viral gene expression if the grain count was more than six times the background. (A) In the upper panel, follicular localization of HIV-1 mRNA (blue-green, using reflected light) is indicated by black arrows at (estimated) day 18 postinfection (subject 503). Original magnification, ×50. The lower panel depicts a higher magnification (×100) of a biopsy from subject 131 at (estimated) 25 days postinfection. Scattered HIV-1-infected cells are noted in the lymphoid follicle (blue-green, reflected light), along with delicate viral trapping (faint, reticular green in subject 131). Virus trapping could not be detected in the germinal center (GC) in subject 503 at day 18 postinfection. (B) HIV gene expression (black, using transmitted light) in proliferating (MIB-1/Ki67+; red) and nonproliferating cells. Panel I shows the edge of a germinal center (GC, subject 503, 18 days postinfection) with the RNA-producing, Ki67+ cell. Panel II depicts the extrafollicular lymphoid tissue (subject 502, 19 days postinfection) showing a Ki67+ cell with low grain count (red arrow) and a Ki67 cell with a high grain count (black arrow). Original magnification, ×100. (C) Panel I shows an HLA-DR (red)-expressing cell containing HIV-1 RNA (black, transmitted light). A sample from subject 502 at (estimated) 19 days postinfection is shown. Original magnification, ×100. Panel II depicts the same study subject. The HIV-1 RNA+ cell (blue-green signal, reflected light) does not express HLA-DR. Original magnification, ×100.
FIG. 3.
FIG. 3.
Immunological phenotype of PBMC and MMCs during acute and early HIV-1 infection. (A) Representative flow cytometry plots comparing effector memory cells between an HIV-uninfected control (upper panels) and a subject with acute HIV-1 infection (lower panels). PBMC (left column) and MMCs (right column) were initially identified on the basis of forward- and side-scatter characteristics. CD3+/CD4+ gated PBMC and MMCs were then analyzed for the expression of CD62L (x axis) and CCR7 (y axis). (B) Cumulative data from HIV-uninfected controls and AEI subjects comparing effector memory cells (CCR7-CD62L-, depicted on the Y-axis) between PBMC and MMCs (both shown on the X-axis). As described above, CD3+CD4+ gated PBMC and MMCs were flow cytometrically analyzed for coexpression of CCR7 and CD62L here. (C) Representative flow cytometry plots comparing activated memory cells between an HIV-uninfected control (upper panels) and a subject with acute HIV-1 infection (lower panels). PBMC (left column) and MMCs (right column) were initially identified on the basis of forward and side scatter characteristics. CD3+/CD4+ gated PBMC and MMCs were then analyzed for the expression of CD45RO (x axis) and CD38 (y axis). (D) Cumulative data from HIV-uninfected controls and AEI subjects comparing activated memory CD4+ T cells (CD3+/CD4+ gated PBMC and MMCs coexpressing CD45RO and CD38, depicted on the y axis).
FIG. 3.
FIG. 3.
Immunological phenotype of PBMC and MMCs during acute and early HIV-1 infection. (A) Representative flow cytometry plots comparing effector memory cells between an HIV-uninfected control (upper panels) and a subject with acute HIV-1 infection (lower panels). PBMC (left column) and MMCs (right column) were initially identified on the basis of forward- and side-scatter characteristics. CD3+/CD4+ gated PBMC and MMCs were then analyzed for the expression of CD62L (x axis) and CCR7 (y axis). (B) Cumulative data from HIV-uninfected controls and AEI subjects comparing effector memory cells (CCR7-CD62L-, depicted on the Y-axis) between PBMC and MMCs (both shown on the X-axis). As described above, CD3+CD4+ gated PBMC and MMCs were flow cytometrically analyzed for coexpression of CCR7 and CD62L here. (C) Representative flow cytometry plots comparing activated memory cells between an HIV-uninfected control (upper panels) and a subject with acute HIV-1 infection (lower panels). PBMC (left column) and MMCs (right column) were initially identified on the basis of forward and side scatter characteristics. CD3+/CD4+ gated PBMC and MMCs were then analyzed for the expression of CD45RO (x axis) and CD38 (y axis). (D) Cumulative data from HIV-uninfected controls and AEI subjects comparing activated memory CD4+ T cells (CD3+/CD4+ gated PBMC and MMCs coexpressing CD45RO and CD38, depicted on the y axis).
FIG. 4.
FIG. 4.
Increase in proliferating CD4+ T cells in the GI tract during acute and early HIV-1 infection. (A) Representative flow cytometry plot from a subject with acute HIV-1 infection (subject 147) comparing CD4+ T cells (shown on the x axis) and Ki67 (shown on the y axis). The left panel depicts the isotype control for Ki67, the middle panel represents the PBMC compartment, and the right panel shows the MMC compartment. (B) CD3+/CD4+ gated PBMC and MMCs (shown on the x axis) were flow cytometrically examined for the percentage of Ki67+ cells (shown on the y axis) in HIV-uninfected controls and AEI subjects. (C) Examination of proliferating cells (MIB-1/Ki67+) within the gastrointestinal lamina propria by immunohistochemistry during AEI. Double labeling for CD4 (brown) and Ki-67 (blue) demonstrates cycling CD4+ lymphocytes (arrows). Panels I and III depict low (×50)- and high (×160)-power views, respectively, from an HIV-uninfected control. Panels II and IV show low- and high-power views from a subject with acute HIV-1 infection.
FIG. 4.
FIG. 4.
Increase in proliferating CD4+ T cells in the GI tract during acute and early HIV-1 infection. (A) Representative flow cytometry plot from a subject with acute HIV-1 infection (subject 147) comparing CD4+ T cells (shown on the x axis) and Ki67 (shown on the y axis). The left panel depicts the isotype control for Ki67, the middle panel represents the PBMC compartment, and the right panel shows the MMC compartment. (B) CD3+/CD4+ gated PBMC and MMCs (shown on the x axis) were flow cytometrically examined for the percentage of Ki67+ cells (shown on the y axis) in HIV-uninfected controls and AEI subjects. (C) Examination of proliferating cells (MIB-1/Ki67+) within the gastrointestinal lamina propria by immunohistochemistry during AEI. Double labeling for CD4 (brown) and Ki-67 (blue) demonstrates cycling CD4+ lymphocytes (arrows). Panels I and III depict low (×50)- and high (×160)-power views, respectively, from an HIV-uninfected control. Panels II and IV show low- and high-power views from a subject with acute HIV-1 infection.
FIG. 5.
FIG. 5.
Significant increase in the cytotoxic granules perforin, granzyme B, and TIA-1 in the GI tract during AEI. (A and B) Cells expressing cytotoxic granules perforin, granzyme B, and TIA-1 (represented on the x axis) per unit area (shown on the y axis) were examined by immunohistochemistry within mucosal inductive (Fig. 5A) and effector (Fig. 5B) sites in HIV-uninfected controls and AEI subjects. (C) Panel I depicts representative sections from an HIV-uninfected control showing the few cytotoxic granule-positive cells (black arrows). Original magnification, ×100. Panel II shows representative biopsy sections from a subject with AEI depicting abundant cells expressing perforin, granzyme B, and TIA-1 in the GI lamina propria. Red arrows indicate intraepithelial cells expressing perforin, granzyme B, and TIA-1, respectively. Original magnification, ×100.
FIG. 5.
FIG. 5.
Significant increase in the cytotoxic granules perforin, granzyme B, and TIA-1 in the GI tract during AEI. (A and B) Cells expressing cytotoxic granules perforin, granzyme B, and TIA-1 (represented on the x axis) per unit area (shown on the y axis) were examined by immunohistochemistry within mucosal inductive (Fig. 5A) and effector (Fig. 5B) sites in HIV-uninfected controls and AEI subjects. (C) Panel I depicts representative sections from an HIV-uninfected control showing the few cytotoxic granule-positive cells (black arrows). Original magnification, ×100. Panel II shows representative biopsy sections from a subject with AEI depicting abundant cells expressing perforin, granzyme B, and TIA-1 in the GI lamina propria. Red arrows indicate intraepithelial cells expressing perforin, granzyme B, and TIA-1, respectively. Original magnification, ×100.
FIG. 6.
FIG. 6.
Phenotypic characterization of perforin expressing cells. Immunohistochemical double labeling for CD8 (red) and perforin (blue) shows that a proportion of perforin containing cells are CD8+ T cells (black arrows). Cells that are negative for CD8 but contain perforin are also present (blue arrows). Original magnification, ×160.

Similar articles

Cited by

References

    1. Andersson, J., H. Behbahani, J. Lieberman, E. Connick, A. Landay, B. Patterson, A. Sonnerborg, K. Lore, S. Uccini, and T. E. Fehniger. 1999. Perforin is not coexpressed with granzyme A within cytotoxic granules in CD8 T lymphocytes present in lymphoid tissue during chronic HIV infection. Aids 13:1295-1303. - PubMed
    1. Andersson, J., S. Kinloch, A. Sonnerborg, J. Nilsson, T. E. Fehniger, A. L. Spetz, H. Behbahani, L. E. Goh, H. McDade, B. Gazzard, H. Stellbrink, D. Cooper, and L. Perrin. 2002. Low levels of perforin expression in CD8+ T lymphocyte granules in lymphoid tissue during acute human immunodeficiency virus type 1 infection. J. Infect. Dis. 185:1355-1358. - PubMed
    1. Brenchley, J. M., T. W. Schacker, L. E. Ruff, D. A. Price, J. H. Taylor, G. J. Beilman, P. L. Nguyen, A. Khoruts, M. Larson, A. T. Haase, and D. C. Douek. 2004. CD4+ T-cell depletion during all stages of HIV disease occurs predominantly in the gastrointestinal tract. J. Exp. Med. 200:749-759. - PMC - PubMed
    1. Estes, J. D., B. F. Keele, K. Tenner-Racz, P. Racz, M. A. Redd, T. C. Thacker, Y. Jiang, M. J. Lloyd, S. Gartner, and G. F. Burton. 2002. Follicular dendritic cell-mediated up-regulation of CXCR4 expression on CD4 T cells and HIV pathogenesis. J. Immunol. 169:2313-2322. - PubMed
    1. Fackler, O. T., M. Schafer, W. Schmidt, T. Zippel, W. Heise, T. Schneider, M. Zeitz, E. O. Riecken, N. Mueller-Lantzsch, and R. Ullrich. 1998. HIV-1 p24 but not proviral load is increased in the intestinal mucosa compared with the peripheral blood in HIV-infected patients. AIDS 12:139-146. - PubMed

Publication types

MeSH terms