. 2006 Nov 14;103(46):17355-60.
doi: 10.1073/pnas.0607274103. Epub 2006 Oct 25.

Genotypic predictors of human immunodeficiency virus type 1 drug resistance

Affiliations

Genotypic predictors of human immunodeficiency virus type 1 drug resistance

Soo-Yon Rhee et al. Proc Natl Acad Sci U S A. .

Abstract

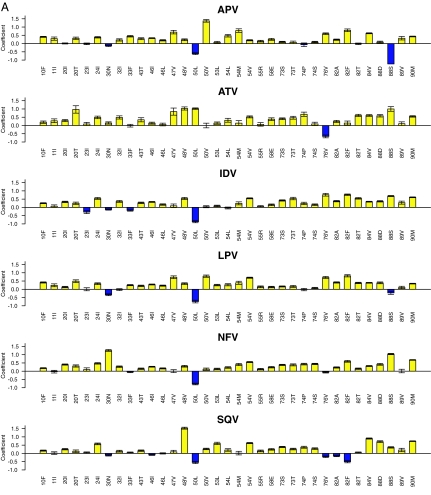
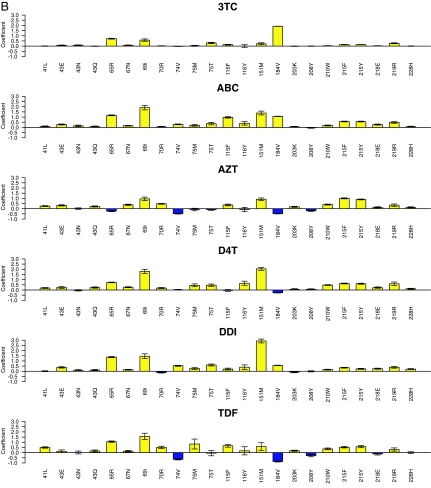
Understanding the genetic basis of HIV-1 drug resistance is essential to developing new antiretroviral drugs and optimizing the use of existing drugs. This understanding, however, is hampered by the large numbers of mutation patterns associated with cross-resistance within each antiretroviral drug class. We used five statistical learning methods (decision trees, neural networks, support vector regression, least-squares regression, and least angle regression) to relate HIV-1 protease and reverse transcriptase mutations to in vitro susceptibility to 16 antiretroviral drugs. Learning methods were trained and tested on a public data set of genotype-phenotype correlations by 5-fold cross-validation. For each learning method, four mutation sets were used as input features: a complete set of all mutations in > or =2 sequences in the data set, the 30 most common data set mutations, an expert panel mutation set, and a set of nonpolymorphic treatment-selected mutations from a public database linking protease and reverse transcriptase sequences to antiretroviral drug exposure. The nonpolymorphic treatment-selected mutations led to the best predictions: 80.1% accuracy at classifying sequences as susceptible, low/intermediate resistant, or highly resistant. Least angle regression predicted susceptibility significantly better than other methods when using the complete set of mutations. The three regression methods provided consistent estimates of the quantitative effect of mutations on drug susceptibility, identifying nearly all previously reported genotype-phenotype associations and providing strong statistical support for many new associations. Mutation regression coefficients showed that, within a drug class, cross-resistance patterns differ for different mutation subsets and that cross-resistance has been underestimated.


Conflict of interest statement

The authors declare no conflict of interest.

Figures

Fig. 1.
Fig. 1.
LSR coefficients for PI (A) and NRTI (B) TSMs. Shown are regression coefficients of the LSR models for PI susceptibility using nonpolymorphic PI TSMs (A) and NRTI using nonpolymorphic NRTI TSMs (B). The y axis indicates the magnitude of the coefficient. Positive coefficients (yellow histograms) indicate mutations that decrease drug susceptibility; negative coefficients (blue histograms) indicate mutations that increase drug susceptibility. The y axis has no units because the log-fold susceptibility changes were normalized before regression analysis. The error bars indicate the standard deviation of the mean generalized error determined 50 times (10 repetitions of 5-fold cross-validation). For the PIs (n = 35) and NRTIs (n = 23), the mutations shown are those that occurred ≥10 times in the data set and for which the absolute value of the coefficient was ≥3.0 times the standard deviation for one or more drugs. The regression coefficients for the PI ritonavir and for the NNRTIs are shown in Tables 8 and 10, respectively.
Fig. 1.
Fig. 1.
LSR coefficients for PI (A) and NRTI (B) TSMs. Shown are regression coefficients of the LSR models for PI susceptibility using nonpolymorphic PI TSMs (A) and NRTI using nonpolymorphic NRTI TSMs (B). The y axis indicates the magnitude of the coefficient. Positive coefficients (yellow histograms) indicate mutations that decrease drug susceptibility; negative coefficients (blue histograms) indicate mutations that increase drug susceptibility. The y axis has no units because the log-fold susceptibility changes were normalized before regression analysis. The error bars indicate the standard deviation of the mean generalized error determined 50 times (10 repetitions of 5-fold cross-validation). For the PIs (n = 35) and NRTIs (n = 23), the mutations shown are those that occurred ≥10 times in the data set and for which the absolute value of the coefficient was ≥3.0 times the standard deviation for one or more drugs. The regression coefficients for the PI ritonavir and for the NNRTIs are shown in Tables 8 and 10, respectively.

References

    1. Beerenwinkel N, Schmidt B, Walter H, Kaiser R, Lengauer T, Hoffmann D, Korn K, Selbig J. Proc Natl Acad Sci USA. 2002;99:8271–8276. - PMC - PubMed
    1. Wang K, Jenwitheesuk E, Samudrala R, Mittler JE. Antivir Ther. 2004;9:343–352. - PubMed
    1. Sevin AD, DeGruttola V, Nijhuis M, Schapiro JM, Foulkes AS, Para MF, Boucher CA. J Infect Dis. 2000;182:59–67. - PubMed
    1. Wang D, Larder B. J Infect Dis. 2003;188:653–660. - PubMed
    1. Beerenwinkel N, Daumer M, Oette M, Korn K, Hoffmann D, Kaiser R, Lengauer T, Selbig J, Walter H. Nucleic Acids Res. 2003;31:3850–3855. - PMC - PubMed

Publication types

Substances