Comparative Study
. 2006 Oct 25;26(43):11083-110.
doi: 10.1523/JNEUROSCI.2766-06.2006.

Potential new antiepileptogenic targets indicated by microarray analysis in a rat model for temporal lobe epilepsy

Affiliations
Comparative Study

Potential new antiepileptogenic targets indicated by microarray analysis in a rat model for temporal lobe epilepsy

Jan A Gorter et al. J Neurosci. .

Abstract

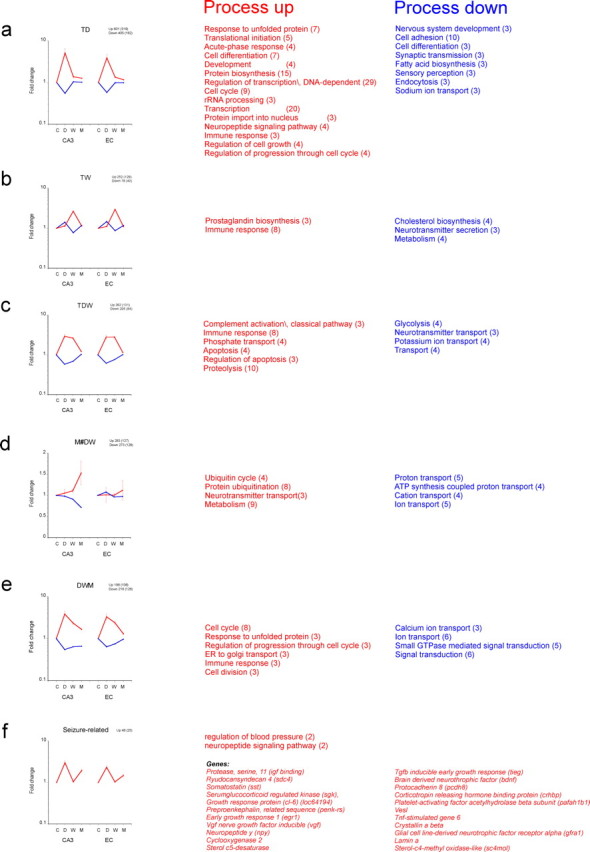
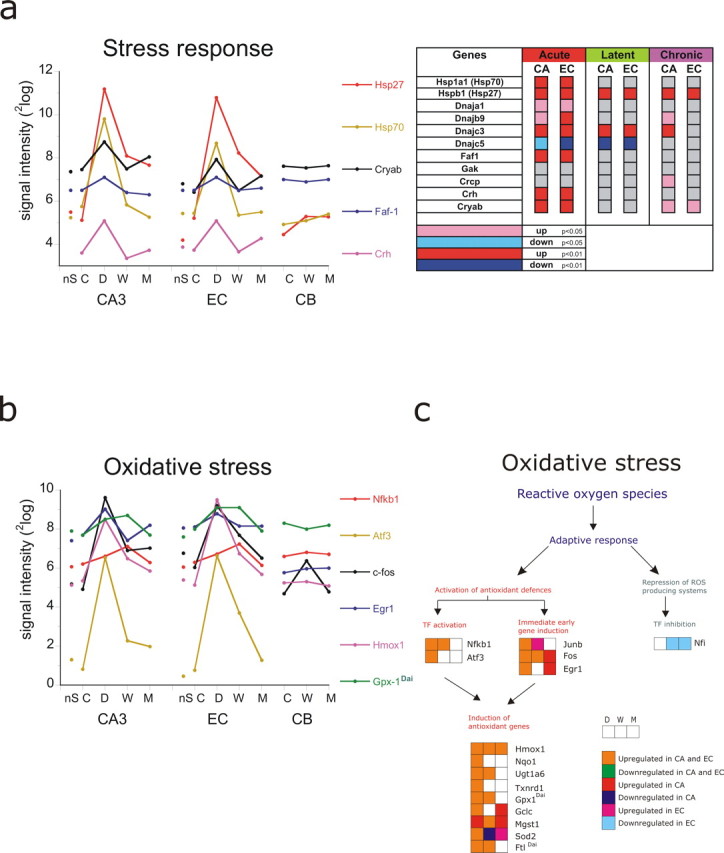
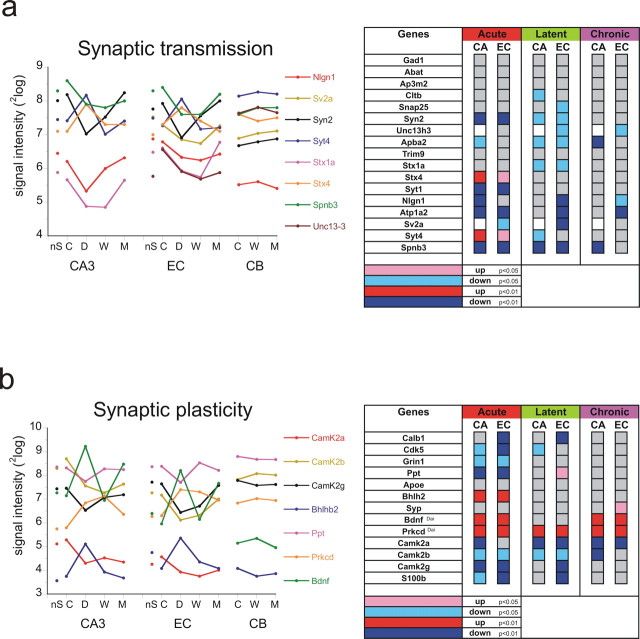
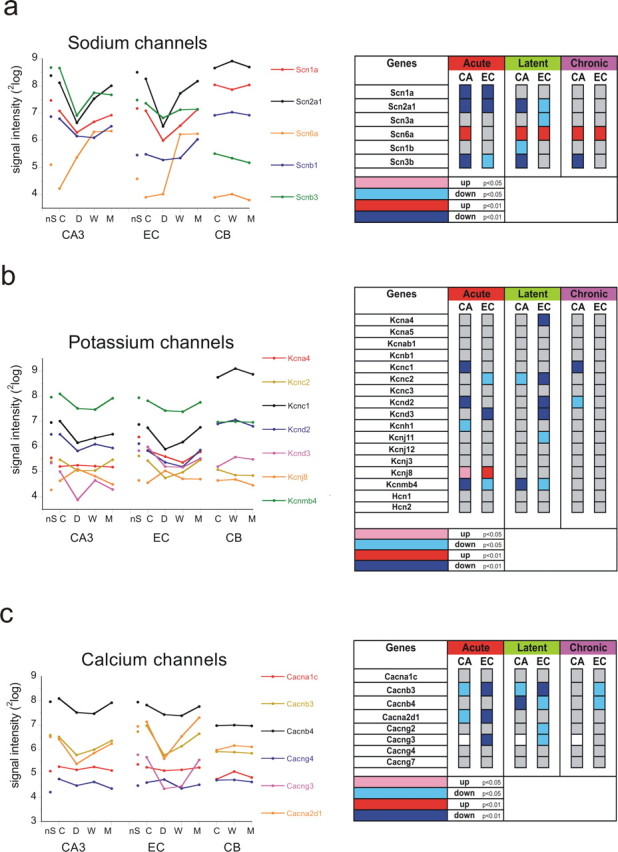
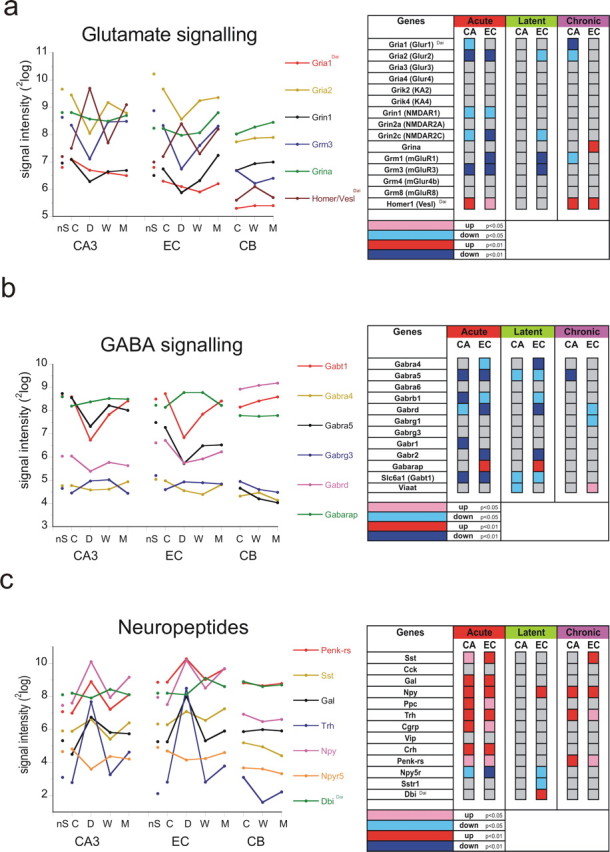
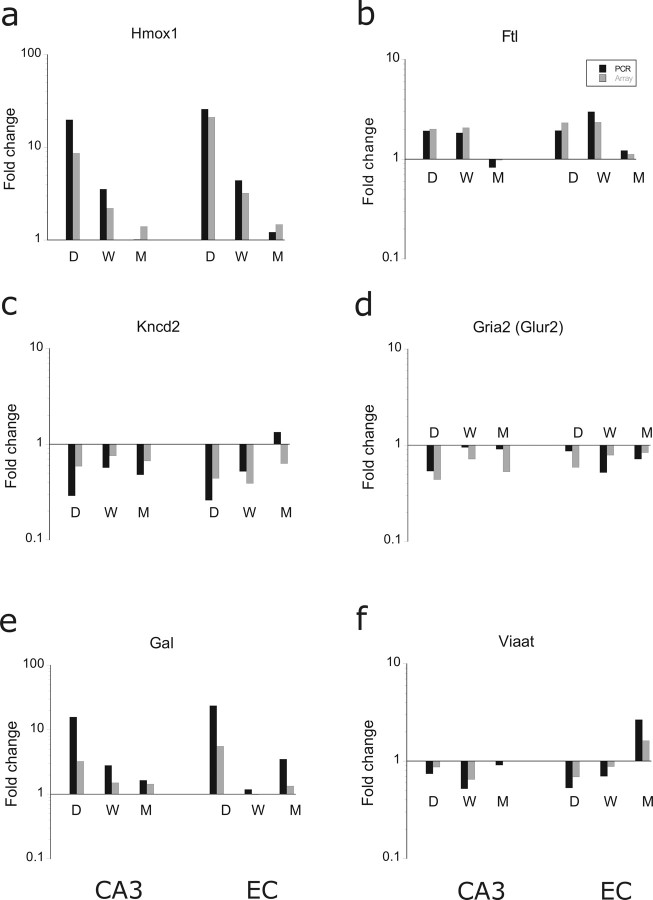
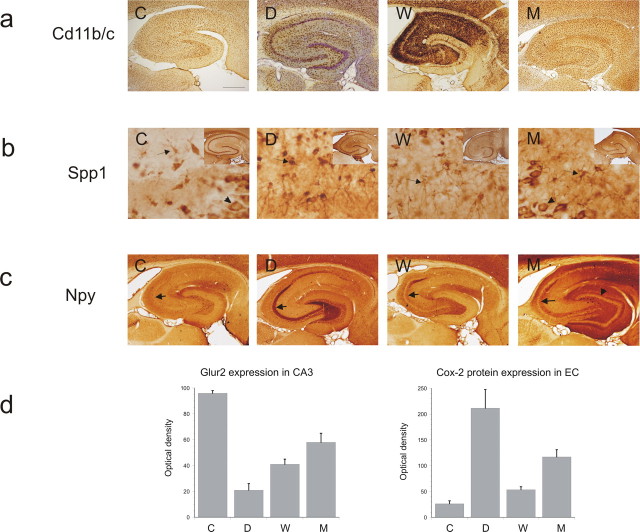
To get insight into the mechanisms that may lead to progression of temporal lobe epilepsy, we investigated gene expression during epileptogenesis in the rat. RNA was obtained from three different brain regions [CA3, entorhinal cortex (EC), and cerebellum (CB)] at three different time points after electrically induced status epilepticus (SE): acute phase [group D (1 d)], latent period [group W (1 week)], and chronic epileptic period [group M (3-4 months)]. A group that was stimulated but that had not experienced SE and later epilepsy was also included (group nS). Gene expression analysis was performed using the Affymetrix Gene Chip System (RAE230A). We used GENMAPP and Gene Ontology to identify global biological trends in gene expression data. The immune response was the most prominent process changed during all three phases of epileptogenesis. Synaptic transmission was a downregulated process during the acute and latent phases. GABA receptor subunits involved in tonic inhibition were persistently downregulated. These changes were observed mostly in both CA3 and EC but not in CB. Rats that were stimulated but that did not develop spontaneous seizures later on had also some changes in gene expression, but this was not reflected in a significant change of a biological process. These data suggest that the targeting of specific genes that are involved in these biological processes may be a promising strategy to slow down or prevent the progression of epilepsy. Especially genes related to the immune response, such as complement factors, interleukins, and genes related to prostaglandin synthesis and coagulation pathway may be interesting targets.


Figures

Figure 1.
Figure 1.
a, Hierarchical clustering showed that the profiles of genetic expression of control rats cluster according to brain area. b, Hierarchical clustering performed on the mean expression values of experimental animals showed that they cluster according to the stage of epileptogenesis, with the exception of the chronic phase. The analysis also showed that changes in gene expression were more similar in CA3 and EC in the early phases than in the chronic phase. The CB group completely separates from the other groups. Red depicts higher expression levels, and blue depicts lower; the deeper shade indicates a larger difference.
Figure 2.
Figure 2.
Scatter diagrams at the three time points after SE (acute, D; latent, W; chronic, M) in CA3, EC, and CB, showing fold change (with respect to control = 1) as a function of the p value of that change (up to 0.15). Significance (p < 0.05) is indicated with shaded area. The scatter is much larger during the acute and latent phases in both CA3 and EC than during chronic phase. Scatter is small in CB during both latent and chronic phases.
Figure 3.
Figure 3.
Number of genes changed (upregulated or downregulated) at p < 0.01 of rats killed at three post-SE stages, D (1 d), W (1 week), and M (3–4 months post-SE), for the CA3 and EC region and the CB. The panels show the average signal expression for the total set of changed genes and accompanying Venn diagrams in which the numbers of downregulated (blue) and upregulated (red) genes exclusively in each area and simultaneously in two or three areas are indicated. For example, in b, 100 were upregulated only in CA3, and 419 only in EC; additionally, 356 were upregulated in both; thus, the fraction of genes that changed in both areas was 77% for CA3 (356 of 464), and for EC (356 of 786), the fraction was 45%. The FDR is indicated in blue (next to each circle).
Figure 4.
Figure 4.
Different waves of gene expression in CA3 and EC. Average fold change (±SEM) of those genes that have significantly changed in CA3 (p < 0.01, with respect to control expression) transiently at 1 d only (TD) (a); at 1 week only (TW) (b); at both 1 d and 1 week (TDW) (c); at the chronic phase only (M#DW) (d); during all three time points (DWM) (e); and “seizure-related” (not changed during the latent period) (f). Except for the M#DW pattern, the average expression pattern is similar in EC. The number of genes involved in each pattern is indicated above each graph (GO-related genes in between brackets). Because there are only 25 genes identified with a seizure-related pattern, a list of these genes is presented. The processes that are significant with each specific pattern are mentioned next to each graph (number of genes involved between brackets).
Figure 5.
Figure 5.
Changes in gene expression after SE related to stress response (a) and oxidative stress (b). Graphs show the signal intensity of six to eight genes in CA3, EC, and CB in the non-SE group (nS), the control group (C), 1 d after SE (D), 1 week after SE (W), and during the chronic phase (M). The statistics of the genes within the GO process are displayed in a color-coded map next to the graph. Genes with a significant change in CA3 or EC of <0.01 are coded in red (up) or dark blue (down), and genes that changed with p < 0.05 are coded in pink (up) and light blue (down). c, Scheme adapted from Morel et al. (1999) that shows the adaptive response during each phase (DWM) on reactive oxygen species. Orange indicates upregulated in CA3 and EC, and green is downregulated in CA3 and EC. Red is upregulated in CA3 only. Pink is upregulated in EC only. Blue is downregulated in CA3 only. Light blue is downregulated in EC only. Gene abbreviations are presented in Table 4.
Figure 6.
Figure 6.
Changes in gene expression after SE related to immune response (a) and cytokine production (b). Graphs show the signal intensity of eight genes in CA3, EC, and CB in the non-SE group (nS), the control group (C), 1 d after SE (D), 1 week after SE (W), and during the chronic phase (M). The statistics of the genes within the GO process are displayed in a color-coded map next to each graph. Genes with a significant change in CA3 or EC of <0.01 are coded in red (up) or dark blue (down), and genes that changed with p < 0.05 are coded in pink (up) and light blue (down). White indicates “not present.” Gene abbreviations are presented in Table 4.
Figure 7.
Figure 7.
Changes in gene expression after SE related to prostaglandin regulation (a), complement activation (b), and coagulation factors (c). Graphs show the signal intensity of six to eight genes in CA3, EC, and CB in the non-SE group (nS), the control group (C), 1 d after SE (D), 1 week after SE (W), and during the chronic phase (M). The statistics of the genes within the GO process are displayed in a color-coded map next to each graph. Notice the seizure-related regulation of Cox-2, the strong activation of coagulation factors (F10), and the strong activation of complement factors in the latent period, which can persist into the chronic phase [complement component 3 (C3)]. Gene abbreviations are presented in Table 4.
Figure 8.
Figure 8.
Expression of genes related to synaptic transmission and plasticity. Changes in gene expression in the three regions after SE related to synaptic transmission (a) and plasticity (b). Graphs show the signal intensity of six to eight genes in CA3, EC, and CB in the non-SE group (nS), the control group (C), 1 d after SE (D), 1 week after SE (W) and during the chronic phase (M). The statistics of the genes within the GO process are displayed in a color-coded map next to each graph. Notice that most but not all of the synaptic proteins are downregulated after SE and recover to a large extent during epileptogenesis. b, Plasticity-related genes such as the CaMKIIa are downregulated after SE and remain so during all three phases. Protein kinase C δ (Prkcd) and brain-derived neurotrophic factor (Bdnf) are still upregulated during the chronic epileptic phase in CA3 and EC. Gene abbreviations are presented in Table 4.
Figure 9.
Figure 9.
Expression of genes related to ion channels. Changes in gene expression in the three regions after SE related to sodium channels (a), potassium channels (b), and calcium channels (c). Graphs show the signal intensity of six to eight genes in CA3, EC, and CB in the non-SE group (nS), the control group (C), 1 d after SE (D), 1 week after SE (W), and during the chronic phase (M). The statistics of the genes within the GO process are displayed in a color-coded map next to each graph. Notice that different subunits of the ion channels are downregulated after SE but recover to a large extent. The exception is the Scn6a channel, which is persistently upregulated in CA3 and EC but not in CB. Gene abbreviations are presented in Table 4.
Figure 10.
Figure 10.
Expression of genes related to neurotransmitter receptors. Changes in gene expression in the three regions after SE related to glutamate signaling (a), GABA signaling (b), and neuropeptides (c). Graphs show the signal intensity of six to eight genes in CA3, EC, and CB in the non-SE group (nS), the control group (C), 1 d after SE (D), 1 week after SE (W), and during the chronic phase (M). The statistics of the genes within the GO process are displayed in a color-coded map next to each graph. Notice that several subunits of the glutamate receptor channels were significantly downregulated after SE and have recovered to a large extent during the chronic phase. a, Homer/Vesl was the exception with a biphasic, seizure-related upregulation. b, GABA receptor subunit α5 (CA3) and δ (EC), two subunits involved in tonic inhibition, were permanently downregulated. c, Several neuropeptides had a biphasic upregulation. Gene abbreviations are presented in Table 4.
Figure 11.
Figure 11.
PCR comparison with array expression. Graphs showing the fold change (with respect to control) during the post-SE time points in CA3 and EC. PCR analysis shows a large correspondence with the array expression patterns of the different genes. Hmox1, Heme oxygenase 1; Ftl, Ferritin light chain 1; Kncd2, potassium voltage-gated channel, Shal-related family 2; Gria2, ionotropic glutamate receptor subunit 2; Gal, galanin; Viaat, vesicular inhibitory amino acid transporter.
Figure 12.
Figure 12.
Immunohistochemistry and Western blot. Immunocytochemistry of CD11b/c (Ox42) (a), Spp1 (Osteopontin) (b), and Neuropeptide Y (Npy) (c). a, Microglial activation that was induced at 1 d, peaked at 1 week after SE, and recovers to large extent in the chronic phase. b, Spp1 expression in control (C) is present in neurons and glial cells with microglial morphology; at 1 d (D) is strongly induced in microglial cells with ameboid morphology and still increased in glial cells with microglial and astroglial morphology at 1 week (W). In the chronic phase, some microglial cell still show increased Spp1 expression. c, In control (C), the strongest Npy expression was found in individual neurons scattered throughout hippocampus; Npy expression was strongly induced at 1 d (D) in the mossy fiber endings in hilus and CA3, but also in CA1 neurons and granule cells and in cortical regions. In the latent period (W), Npy expression was much lower than at 1 d after SE. In the chronic epileptic phase (M), Npy expression increased again in mossy fibers in CA3 (arrows) but also in the mossy fibers that had sprouted to the inner molecular layer of the dentate gyrus (arrowheads). Scale bar: a, c, 400 μm; b, 80 μm. d, Two Western blots of ionotropic AMPA2 receptor Gria2 (also Glur2) taken from CA3 material and Cox-2 taken from the EC. Both patterns were similar to the pattern observed with the microarray gene expression.

References

    1. Aloisi F. The role of microglia and astrocytes in CNS immune surveillance and immunopathology. Adv Exp Med Biol. 1999;468:123–133. - PubMed
    1. Arion D, Sabatini M, Unger T, Pastor J, Alonso-Nanclares L, Ballesteros-Yanez I, Garcia Sola R, Munoz A, Mirnics K, Defelipe J. Correlation of transcriptome profile with electrical activity in temporal lobe epilepsy. Neurobiol Dis. 2006;22:374–387. - PubMed
    1. Aronica E, Vliet van EA, Mayboroda O, Troost D, Lopes da Silva FH, Gorter JA. Upregulation of metabotropic glutamate receptor subtype mGluR3 and mGluR5 in reactive astrocytes in a rat model of mesial temporal lobe epilepsy. Eur J Neurosci. 2000;12:2333–2345. - PubMed
    1. Avoli M, D'Antuono M, Louvel J, Kohling R, Biagini G, Pumain R, D'Arcangelo G, Tancredi V. Network and pharmacological mechanisms leading to epileptiform synchronization in the limbic system in vitro. Prog Neurobiol. 2002;68:167–207. - PubMed
    1. Bammler T, Beyer RP, Bhattacharya S, Boorman GA, Boyles A, Bradford BU, Bumgarner RE, Bushel PR, Chaturvedi K, Choi D, Cunningham ML, Deng S, Dressman HK, Fannin RD, Farin FM, Freedman JH, Fry RC, Harper A, Humble MC, Hurban P, et al. Standardizing global gene expression analysis between laboratories and across platforms. Nat Methods. 2005;2:351–356. - PubMed

Publication types

Substances

LinkOut - more resources