. 2007 Jan;18(1):211-28.
doi: 10.1091/mbc.e06-05-0445. Epub 2006 Oct 25.

Plasma membrane sterol distribution resembles the surface topography of living cells

Affiliations

Plasma membrane sterol distribution resembles the surface topography of living cells

Daniel Wüstner. Mol Biol Cell. 2007 Jan.

Abstract

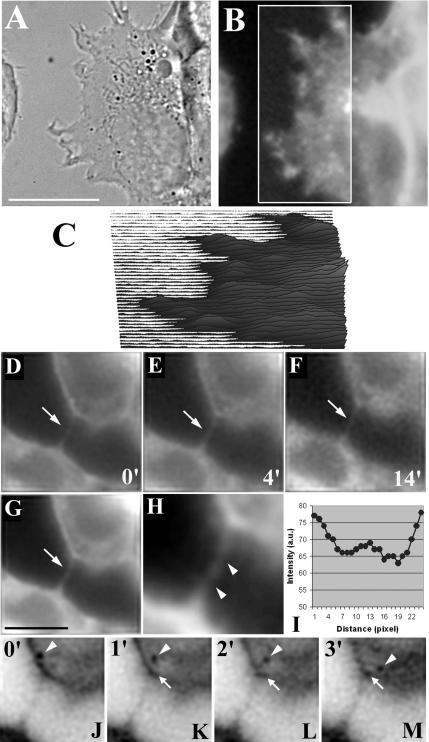
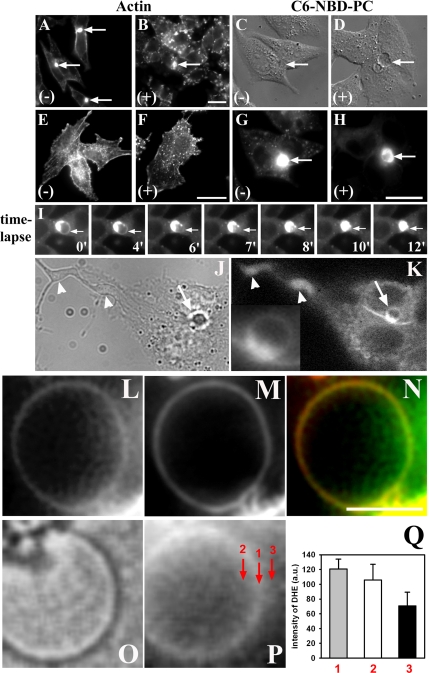
Cholesterol is an important constituent of cellular membranes. It has been suggested that cholesterol segregates into sterol-rich and -poor domains in the plasma membrane, although clear evidence for this is lacking. By fluorescence imaging of the natural sterol dehydroergosterol (DHE), the lateral sterol distribution has been visualized in living cells. The spatial labeling pattern of DHE coincided with surface structures such as ruffles, microvilli, and filopodia with correlation lengths in the range of 0.8-2.5 microm. DHE staining of branched tubules and of nanotubes connecting two cells was detected. Dynamics of DHE in folded and plane membrane regions was comparable as determined by fluorescence recovery after photobleaching. DHE colocalized with fluid membrane-preferring phospholipids in surface structures and at sites of cell attachment as well as in the cleavage furrow of dividing cells, but it was not particularly enriched in those regions. Fluorescent sterol showed homogeneous staining in membrane blebs induced by F-actin disruption. Cross-linking the ganglioside GM1--a putative raft marker--did not affect the cell surface distribution of DHE. The results suggest that spatial heterogeneities of plasma membrane staining of DHE resolvable by light microscopy reflect the cell surface topography but not phase-separated sterol domains in the bilayer plane.


Figures

Figure 1.
Figure 1.
Surface dynamics and DHE staining pattern in polarized HepG2 cells. (A–D) DIC time-lapse series of a polarized HepG2 cell couplet showing slow closing of the central BC (big arrow) as well as periodic formation and retraction of filopodia at the basolateral cell surface (small arrows). E, quantification of BC closing from DIC images gives an approximative half-time of t1/2 ∼40 min. (F–K) Cells were labeled for 1 min with DHE/MCD, washed, and imaged. Images were acquired in a stack along the optical axis, corrected for bleaching, and 3D deconvolved. F, sum projection of three central planes of the HepG2 couplet shown in A–D reveals DHE staining of filopodia extending from the basolateral cell surface. (G–K) Representative planes of a z-stack of DHE-labeled polarized HepG2 cells. (G) Open BC with large diameter shows microvilli protruding into the BC lumen. (H–K) Single planes of BC with very small diameter acquired along the z-axis being 0.5 μm apart starting from the largest diameter in H. (L and M) 3D reconstruction of the large-diameter (L) and the small-diameter BC (M) calculated from the whole z-stacks as described in Materials and Methods, reveals that both BC have a lumen with reduced DHE intensity compared with the brightly stained canalicular membrane. Bar, 20 μm (A–F) or 5 μm (G–K).
Figure 2.
Figure 2.
DHE staining of the plasma membrane reflects cell surface topography. HepG2 cells were pulse labeled with DHE/MCD for 1 min at 37°C, washed, and imaged. A 2D deconvolution algorithm implemented in the Huygens software (Scientific Volume Imaging) was applied to improve spatial resolution. DHE-labeled filopodia and microridges at the basolateral membrane (B), which match exactly structures in the corresponding DIC image (A). (C) Surface plot of the intensity distribution of DHE from the outlined region of the image in B. (D–M) Cells were pulse-labeled with DHE/MCD, washed, and immediately placed on a nitrogen-floated microscope stage of a wide field microscope maintained at 35 ± 1°C. Images were acquired every minute for a total time of 14 min. Images were postprocessed by applying a low pass filter implemented in Scion Image (Scion). D–G, a tubule connecting two HepG2 cells is shown that is labeled with DHE (arrows) and stable for at least 14 min (compare D with F). (G) Average image obtained from the first four acquisitions plus low pass filter to improve signal-to-noise ratio. (H) Zoomed version of G. Along the tubule, the DHE-labeling pattern is heterogeneous (arrowheads in H). This can be also inferred from the line scan along the central region of the tubule shown in H (I). (J–M) Representative inverted images of the time-lapse sequence show that a vesicle (arrowheads) moves from the cytoplasm toward the tubule in the upper cell being connected to the lower cell by the nanotube. Vesicles were also found at the site of nanotube–cell attachment in the upper cell (small arrows). Bar, 5 μm.
Figure 3.
Figure 3.
Visualization of DHE in the plasma membrane of TRVb1 cells. Cells were pulse-labeled with DHE/MCD for 1 min at 37°C, washed, and imaged. (A–C) CHO cells grow occasionally in an overlapping mode. In overlapping regions, DHE fluorescence (B) is exactly twice as high as in other flat plasma membrane areas as inferred from a line scan (C) of the intensity in contact regions (line in B). (A) Bright field image corresponding to B. (D–I) DHE is found in membrane tubules emanating from the cell surface. The variation in tubule diameter visible in the DIC image (D and H) is exactly matched by DHE fluorescence in the tubule (E and I). This can be clearly seen in the zoomed region (H and I) outlined by the box 2 in D and E. Emanating membrane tubules are often branched as visible in the DIC (F) and DHE channel (G) of the zoomed box 1 of the field shown in D and E. Bar, 10 μm.
Figure 4.
Figure 4.
Quantification of heterogeneous plasma membrane staining of DHE. (A–F) TRVb1 cells were pulse labeled with DHE/MCD for 1 min at 37°C, washed, and imaged. The surface topology of TRVb1 cells is characterized by a network of branching filopodia as well as many small infolds clearly visible in the transmitted light (A and E) and DHE channel (B, C, and F). Note that in A–C the focus was set to the largest cell diameter close to the glass surface of the microscope dish to visualize the cell perimeter as well as the branched filopodia. Images of DHE were inverted (B, C, and F) for better visualization. A line scan (red in C) along the plasma membrane perimeter measures fluorescence intensity of DHE determined from the noninverted image (D). The inverted image of a DHE-labeled cell revealed fluorescence spots on the base of membrane infolds (arrowheads in F) as well as in small cytoplasmic vesicles (arrows in F). (G and H) HepG2 cells were pulse-labeled with DHE/MCD for 1 min at 37°C, washed, and imaged. (I and J) Synthetic images of a cell were generated as described in Materials and Methods. Using the variance filter with a 7-pixel filter width a synthetic membrane image was generated and either Gaussian (I) or Poisson noise (J) was added. (K and L) line intensities along the synthetic plasma membrane + Poisson noise (J) were measured (L) and compared with intensities from DHE-labeled HepG2 cell (K). A running median filter was applied to smooth data (gray lines, raw data; black lines, filtered data). (M) HepG2 cells labeled with DHE as described were repeatedly illuminated, and line scans were measured along the plasma membrane after 1 (red line), 7 (blue line), or 15 acquisitions (cyan line). See text for further explanations. Bar, 5 μm.
Figure 5.
Figure 5.
Heterogeneous staining of DHE correlates locally but does not depend on large-scale membrane curvature. J774 cells were labeled for 5 min with DHE/MCD, washed, and imaged in z-stacking modus with planes being 0.5 μm apart. (A) individual planes of a J774 cell shown from the top. (B–D) Line scans along the perimeter of the cell shown in A for planes 0 and 1 (B), planes 2 and 3 (C), and planes 4 and 5 (D); the black and gray lines correspond to the first and second plane in B–D, respectively. (E) Correlation plot for the line scan data shown in B. Dots, data; straight line, linear fit. (F) Correlation coefficients calculated with a bivariate analysis between successive planes starting from plane 0 (black curve) or plane 2 (gray curve). (G–K) Parallel analysis of cell shape and DHE membrane intensity by using an active contour (snake) model. (G) Plane 3 of A with outlines snake contour (dotted line). (H) vertical slices of DHE from a 3D stack along the indicated directions. (I) Cell contour measured by the snake algorithm. (J) Curvature polar plot. (K) Intensity polar plot, where the angle (in degrees) indicates the node number for the snake, and the radius is measured curvature (J) or intensity (K), respectively. Lines indicate the different image planes (see A): plane 0 (black line), plane 3 (light gray line), and plane 5 (dark gray line).
Figure 6.
Figure 6.
DHE colocalizes with BODIPY-PC in attachment sites to the substratum. HepG2 cells were pulse labeled with DHE/MCD for 1 min at 37°C, washed, labeled with β-BODIPY-PC for 1 min at 37°C, washed, and imaged on a wide field microscope in z-stacking modus. (A–C) DHE image stack was 3D deconvolved using Huygens software (Scientific Volume Imaging). Using the surface renderer and isocolocalization modus implemented in Huygens, a 3D surface reconstruction was calculated for DHE colocalizing with β-BODIPY-PC in regions of cell–substrate attachment (D–E) or of two contacting cells (L and M). (F–H) DHE colocalizes with β-BODIPY-PC in the membrane approaching the microscope slide in small patches (arrows). (I–K) Areas of cell–cell contact show increased fluorescence intensity of DHE and β-BODIPY-PC (arrow). From the zoomed 3D surface reconstruction, it becomes obvious that this resembles a thickened membrane area, where the cells are in contact (M). (A, F, and I) DHE. (B, G, and J) β-BODIPY-PC. (C, H, and K) Color overlay with DHE (green) and β-BODIPY-PC (red) showing colocalizing regions in yellow/orange. Bar, 15 μm.
Figure 7.
Figure 7.
Bleach rate imaging and fluorescence recovery after photobleaching of DHE in membrane folds. (A–F) Bleach rate imaging of DHE: HepG2 cells were pulse labeled with DHE/MCD for 1 min at 37°C, washed, and repeatedly imaged on a widefield microscope using 2-s acquisition time. (A) DIC image corresponding to the DHE image (B) of the first acquisition shows a surface protrusion highly labeled by DHE (outlined box). Zoomed version of the region outlined in A and B is shown in C and D, respectively. (E) Same region for the second image acqusition. (F) Ratio image of the first and second acquired image. The ratio image has only the bleaching rate constant as contrast parameter. The absence of any contrast shows that DHE bleaching in the membrane fold is indistinguishable from the rest of the plasma membrane. (G–L) FRAP: HepG2 cells were double-labeled with DHE/MCD and β-BODIPY-PC for 1 min at 37°C, washed, and placed on a temperature-controlled microscope stage maintained at 35 ± 1°C. The focus was set to the interface between cell and substrate (microscope slide). DHE was selectively bleached in regions of increased intensity likely representing folded membrane regions as judged based on the similar fluorescence pattern of β-BODIPY-PC in this area (data not shown, but see outlined circle and Materials and Methods). The field aperture was opened and images were acquired at the indicated time points. Fluorescence recovery was measured in the outlined region (circle in G and see arrows) and plotted as function of time after normalization to total cell-associated DHE fluorescence (L). Bar, 10 μm.
Figure 8.
Figure 8.
DHE is not enriched in surface protrusions compared with BODIPY-PC. HepG2 cells were double labeled with DHE/MCD and β-BODIPY-PC, washed, and imaged in z-stacking modus on a wide field microscope. Corresponding spatially registered planes were background corrected, and the ratio of the DHE image (B) and the β-BODIPY-PC image (A) was calculated. This ratio image (C) was normalized and printed as 8-bit file. (D) PCA of the images in A and B provides two principal components named PC1 and PC2. Pixel intensities in PCA images range from −0.035 to +0.075 (see scale bar) for an 8-bit image format (0–255 possible pixel values), indicating that the difference between DHE and β-BODIPY-PC membrane staining patterns is very low. Calculated eigenvalues l1 = 0.996 and l2 = 0.004 support that there is almost now data scattering (see Materials and Methods for further details on calculations). (E–H) Line intensities (F) measured for a plasma membrane region double labeled with DHE (green in E) and β-BODIPY-PC (red in E, colcoalizing regions are yellow to orange). The intensity ratio measured along the line shown in E according to the intensity profiles in F is almost constant and close to 1 (G). A correlation plot of the line intensity profiles reveals high correlation of fluorescence of DHE and β-BODIPY-PC (R = 0.86) (H, dots, pixel intensities; straight line, linear regression). Bar, 5 μm.
Figure 9.
Figure 9.
Homogeneous staining of membrane blebs by DHE and β-BODIPY-PC. (A, B, E, and F) HepG2 cells incubated in buffer medium ([−], A and E) or in medium containing 20 μM cytochalasin D for 20 min at 37°C ([+], B and F) were fixed with 3.3% PFA for 30 min, permeabilized, and incubated with Alexa488-phalloidin for 30 min at room temperature. Actin disruption removed actin staining associated with the basolateral membrane, whereas actin staining around the BC (arrows) was maintained. Actin stress fibers associated with the membrane close to the coverslip as found in control cells ([−], E) were disturbed after cytochalasin D treatment ([+], F). (C, D, G, and H) Cells were preincubated in the presence ([+], D and H) or absence ([−], C and G) of cytochalasin D, washed, and labeled with C6-NBD-PC for 1 min at 37°C. These cells were washed and chased for 30 min at 37°C in the presence or absence of the drug. BC (arrows) was brightly labeled in control and drug-treated cells. Compared with control cells (C and G), the canalicular membrane looked blebbed in cytochalasin D-treated cells as inferred from the fluorescence image of C6-NBD-PC (H) and the corresponding DIC image (D). (I) Cells treated with cytochalasin D and labeled with C6-NBD-PC as described above were washed and imaged at 37°C on a temperature-controlled nitrogen floated microscope stage maintained at 35 ± 1°C of a wide field microscope. Images were acquired every 1 min after washout of the drug, allowing for observation of resealing of a blebbed BC (arrow) in a time course of 12 min. (J and K) Cells treated with cytochalasin D were labeled for 1 min at 37°C with DHE, washed, and imaged. A blebbing BC stained with DHE (arrow) was found. (L–O) Cytochalasin D-treated cells were double labeled with DHE and β-BODIPY-PC, washed, and imaged in z-stacking modus. Corresponding planes showing a membrane bleb were combined. DHE (L) colocalizes with β-BODIPY-PC (M) along the perimeter of the bleb. (N) Color image with DHE (green) and β-BODIPY-PC (red). (O and P) Bright field (O) and corresponding DHE image (Q) of a membrane bleb. A line scan was measured either exactly along the membrane bleb shown in P (line scan 1), shifted to the inner site of the bleb (line scan 2) or shifted parallel to the outside of the bleb measuring essential background intensity (line scan 3). (Q) Mean intensity ± SD of the line scans: 1, gray bar; 2, white bar; and 3, black bar. Bar, 10 μm (A–H) and 5 μm (L–N).
Figure 10.
Figure 10.
DHE colocalizes with cholera toxin in surface protrusions and the cleavage furrow of dividing cells. (A–L) BMGE cells were labeled with DHE/MCD for 1 min at 37°C, washed, and chilled with ice-cold buffer solution, placed on ice, and incubated for 25 min with 50 μg/ml Alexa488-CTxB. Cells were washed twice with cold and once with warmed buffer and imaged on a wide field microscope. DHE (B) and Alexa488-CTxB (C) show equal membrane staining in lamellopodia-like structures (A–D, arrowhead) and in long, thin tubules emanating from the cell surface (A–D, arrows). Both probes colocalize also in smooth surface areas in the plasma membrane (A′–D′, inset). (D) Color overlay with DHE in green and Alexa488-CTxB in red. (E–S) BMGE cells were triple labeled with DHE (F, J, and O), Alexa488-CTxB (G, K, and N), and DiIC12 (H, L, and P). All three probes show homogeneous staining of the plasma membrane, including lamellopodia (E–H) and long branched tubules (I–L). DHE, Alexa488-CTxB, and DiIC12 show slight enrichment in the cleavage furrow of dividing BMGE cells (M–P). A line scan of color merged images of DHE and Alexa488-CTxB (R) or Alexa488-CTxB and DiIC12 (S) shows that DHE is less enriched in the furrow compared with the other two probes (Q). Colocalization is yellow to orange. (A, E, I, and M) DIC image of the respective fields. Bar, 10 μm, except 5 μm (M–P).
Figure 11.
Figure 11.
Patching of cholera toxin by antibody cross-linking does not affect DHE membrane distribution. (A–L) BMGE cells were labeled with DHE/MCD for 1 min at 37°C, washed, and chilled with ice-cold buffer solution, placed on ice, and incubated for 25 min with 50 μg/ml Alexa488-CTxB. Cells were washed twice with cold buffer and incubated with anti-CTxB antibody for 10 min on ice. Cells were washed and imaged as described in text. Although Alexa488-CTxB occurs in patches after antibody cross-linking (C, G, K, P, and T), DHE shows homogeneous membrane staining (B, F, J, O, and S) as found in control cells (compare Figure 10). Plasma membrane labeling of both probes in lamellopodia (A–D), nanotubes connecting two cells (E–H), along the cell perimeter (I–L), and in membrane blebs (N–Q) is shown. Alexa488-CTxB occurs in large optically resolvable patches (arrows). (M) Line scan along the perimeter of the cell shown in I–L for DHE (see J, black line) and Alexa488-CTxB (see K, red line). Inset shows a correlation plot with linear regression of the line intensity profile revealing low correlation between DHE and Alexa488-CTxB fluorescence (R = 0.45). (R–U) Surface ruffles visible in the DIC image (R, arrowheads) are strongly labeled by DHE (S) but lack any patched Alexa488-CTxB (T). Corresponding DIC images (A, E, I, N, and R) reveal the cell surface shape, whereas color merged images (D, H, L, Q, and U) show DHE in green and Alexa488-CTxB in red, respectively. Bar, 10 μm, except 5 μm (N–Q).

Similar articles

Cited by

References

    1. Ahmed S. N., Brown D. A., London E. On the origin of sphingolipid/cholesterol-rich detergent-insoluble cell membranes: physiological concentrations of cholesterol and sphingolipid induce formation of a detergent-insoluble, liquid-ordered lipid phase in model membranes. Biochemistry. 1997;36:10944–10953. - PubMed
    1. Bagatolli L. A., Gratton E. Two-photon fluorescence microscopy observation of shape changes at the phase transition in phospholipid giant unilamellar vesicles. Biophys. J. 1999;77:2090–2101. - PMC - PubMed
    1. Benninger R. K., Önfelt B., Neil M. A., Davis D. M., French P. M. Fluorescence imaging of two-photon linear dichroism: cholesterol depletion disrupts molecular orientation in cell membranes. Biophys. J. 2005;88:609–622. - PMC - PubMed
    1. Benson D. M., Bryan J., Plant A. L., Gotto A.M.J., Smith L. C. Digital imaging fluorescence microscopy: spatial heterogeneity of photobleaching rate constants in individual cells. J. Cell Biol. 1985;100:1309–1323. - PMC - PubMed
    1. Braet F., Seynaeve C., De Zanger R., Wisse E. Imaging surface and submembranous structures with the atomic force microscope: a study on living cancer cells, fibroblasts and macrophages. J. Microsc. 1998;190:328–338. - PubMed

Publication types

MeSH terms

LinkOut - more resources