

Function and evolution of a gene family encoding odorant binding-like proteins in a social insect, the honey bee (Apis mellifera)
- PMID: 17065610
- PMCID: PMC1626642
- DOI: 10.1101/gr.5075706
Function and evolution of a gene family encoding odorant binding-like proteins in a social insect, the honey bee (Apis mellifera)
Abstract
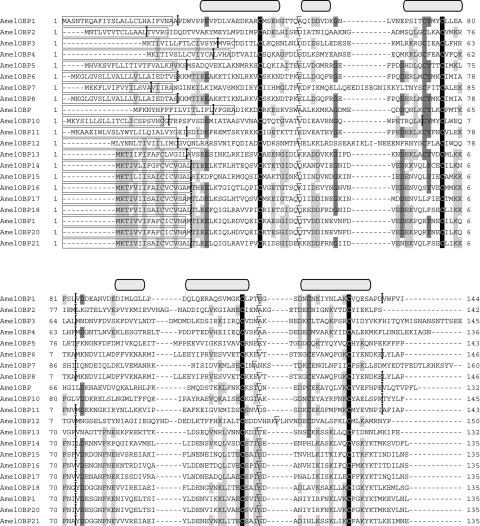
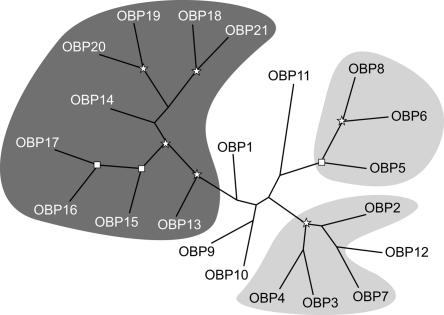
The remarkable olfactory power of insect species is thought to be generated by a combinatorial action of two large protein families, G protein-coupled olfactory receptors (ORs) and odorant binding proteins (OBPs). In olfactory sensilla, OBPs deliver hydrophobic airborne molecules to ORs, but their expression in nonolfactory tissues suggests that they also may function as general carriers in other developmental and physiological processes. Here we used bioinformatic and experimental approaches to characterize the OBP-like gene family in a highly social insect, the Western honey bee. Comparison with other insects shows that the honey bee has the smallest set of these genes, consisting of only 21 OBPs. This number stands in stark contrast to the more than 70 OBPs in Anopheles gambiae and 51 in Drosophila melanogaster. In the honey bee as in the two dipterans, these genes are organized in clusters. We show that the evolution of their structure involved frequent intron losses. We describe a monophyletic subfamily of OBPs where the diversification of some amino acids appears to have been accelerated by positive selection. Expression profiling under a wide range of conditions shows that in the honey bee only nine OBPs are antenna-specific. The remaining genes are expressed either ubiquitously or are tightly regulated in specialized tissues or during development. These findings support the view that OBPs are not restricted to olfaction and are likely to be involved in broader physiological functions.
Figures


References
-
- Altschul S., Madden T., Schaffer A., Zhang J., Zhang Z., Miller W., Lipman D., Madden T., Schaffer A., Zhang J., Zhang Z., Miller W., Lipman D., Schaffer A., Zhang J., Zhang Z., Miller W., Lipman D., Zhang J., Zhang Z., Miller W., Lipman D., Zhang Z., Miller W., Lipman D., Miller W., Lipman D., Lipman D. Gapped BLAST and PSI-BLAST: A new generation of protein database search programs. Nucleic Acids Res. 1997;25:3389–3402. - PMC - PubMed
-
- Bateman A., Coin L., Durbin R., Finn R., Hollich V., Griffiths-Jones S., Khanna A., Marshall M., Moxon S., Sonnhammer E., Coin L., Durbin R., Finn R., Hollich V., Griffiths-Jones S., Khanna A., Marshall M., Moxon S., Sonnhammer E., Durbin R., Finn R., Hollich V., Griffiths-Jones S., Khanna A., Marshall M., Moxon S., Sonnhammer E., Finn R., Hollich V., Griffiths-Jones S., Khanna A., Marshall M., Moxon S., Sonnhammer E., Hollich V., Griffiths-Jones S., Khanna A., Marshall M., Moxon S., Sonnhammer E., Griffiths-Jones S., Khanna A., Marshall M., Moxon S., Sonnhammer E., Khanna A., Marshall M., Moxon S., Sonnhammer E., Marshall M., Moxon S., Sonnhammer E., Moxon S., Sonnhammer E., Sonnhammer E., et al. The Pfam protein families database. Nucleic Acids Res. 2004;32:D138–D141. - PMC - PubMed
-
- Bendtsen J., Nielsen H., von Heijne G., Brunak S., Nielsen H., von Heijne G., Brunak S., von Heijne G., Brunak S., Brunak S. Improved prediction of signal peptides: SignalP 3.0. J. Mol. Biol. 2004;340:783–795. - PubMed
Publication types
MeSH terms
Substances
LinkOut - more resources
Full Text Sources