. 2006;7(10):R99.
doi: 10.1186/gb-2006-7-10-r99. Epub 2006 Oct 26.

Global analysis of mRNA stability in the archaeon Sulfolobus

Affiliations

Global analysis of mRNA stability in the archaeon Sulfolobus

Anders F Andersson et al. Genome Biol. 2006.

Abstract

Background: Transcript half-lives differ between organisms, and between groups of genes within the same organism. The mechanisms underlying these differences are not clear, nor are the biochemical properties that determine the stability of a transcript. To address these issues, genome-wide mRNA decay studies have been conducted in eukaryotes and bacteria. In contrast, relatively little is known about RNA stability in the third domain of life, Archaea. Here, we present a microarray-based analysis of mRNA half-lives in the hyperthermophilic crenarchaea Sulfolobus solfataricus and Sulfolobus acidocaldarius, constituting the first genome-wide study of RNA decay in archaea.

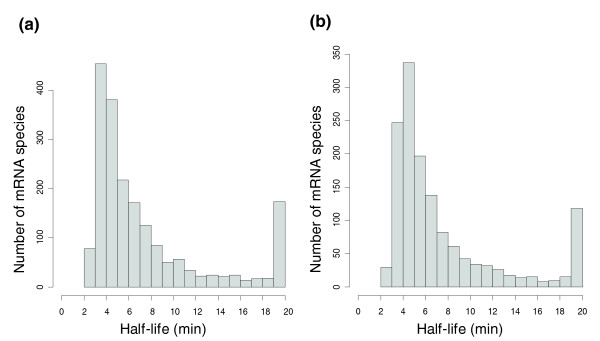
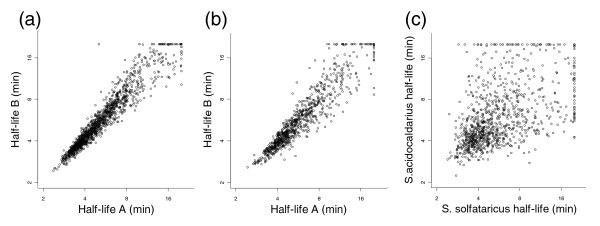
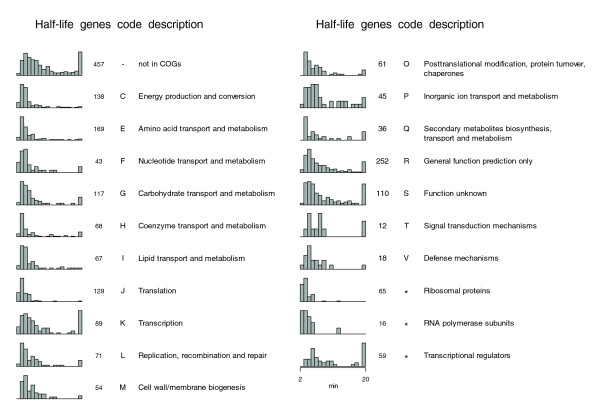
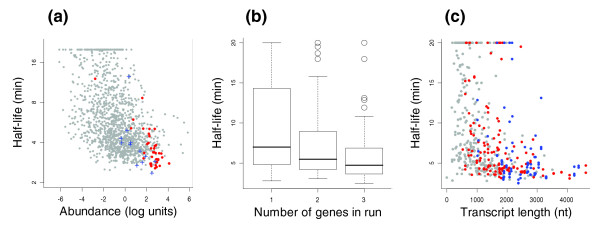
Results: The two transcriptomes displayed similar half-life distributions, with medians of about five minutes. Growth-related genes, such as those involved in transcription, translation and energy production, were over-represented among unstable transcripts, whereas uncharacterized genes were over-represented among the most stable. Half-life was negatively correlated with transcript abundance and, unlike the situation in other organisms, also negatively correlated with transcript length.

Conclusion: The mRNA half-life distribution of Sulfolobus species is similar to those of much faster growing bacteria, contrasting with the earlier observation that median mRNA half-life is proportional to the minimal length of the cell cycle. Instead, short half-lives may be a general feature of prokaryotic transcriptomes, possibly related to the absence of a nucleus and/or more limited post-transcriptional regulatory mechanisms. The pattern of growth-related transcripts being among the least stable in Sulfolobus may also indicate that the short half-lives reflect a necessity to rapidly reprogram gene expression upon sudden changes in environmental conditions.


Figures

Figure 1
Figure 1
mRNA half-life distribution in (a) S. solfataricus and (b) S. acidocaldarius. The right-most bar represents transcripts with t1/2 > 19 minutes.
Figure 2
Figure 2
Comparison of mRNA half-lives obtained in (a) two independent labeling and hybridization assays, and (b) two independent cultures of the same species. (c) Comparison of mRNA half-lives of orthologous genes in S. solfataricus and S. acidocaldarius. Half-lives are shown in log2-scale.
Figure 3
Figure 3
Distributions of S. solfataricus mRNA half-lives, and number of genes with estimated half-lives, for different functional categories in the COG database. Only categories with more than nine genes with estimated half-lives are shown. Each bar in the histogram represents the proportion of genes with a half-life within a 1 minute interval, where the first bar includes half-lives of > 2 but ≤ 3 minutes, the second > 3 but ≤ 4 minutes, and so on. The last bar includes all transcripts with half-lives > 19 minutes. The groups 'Ribosomal proteins' and 'RNA polymerase subunits' are based on the annotations in [26] and 'Transcriptional regulators' on annotations in the COG database.
Figure 4
Figure 4
mRNA half-life in relation to transcript abundance, operon size (in number of genes) and transcript length (in nucleotides) in S. solfataricus. (a) Scatter plot of transcript abundance versus half-life. mRNA half-lives are shown in log2-scale. Transcript abundance represents log2-transformed expression (cDNA/genomic DNA) ratios, normalized such that the average of the log ratios equals zero. Red and blue dots represent genes for ribosomal proteins and polymerase subunits, respectively. (b) Box plots of half-life distributions for transcripts in one-, two- and three-gene runs; 50% of the genes are included in the boxes, and 80% between the whiskers; the line within the box represents the median half-life. (c) Scatter plot of mRNA half-life versus transcript length (counting from first start to last stop codon in each run). Genes belonging to one-, two- and three-gene runs are shown in grey, red and blue, respectively.

References

    1. Fan J, Yang X, Wang W, Wood WH, 3rd, Becker KG, Gorospe M. Global analysis of stress-regulated mRNA turnover by using cDNA arrays. Proc Natl Acad Sci USA. 2002;99:10611–10616. doi: 10.1073/pnas.162212399. - DOI - PMC - PubMed
    1. Ross J. mRNA stability in mammalian cells. Microbiol Rev. 1995;59:423–450. - PMC - PubMed
    1. McAdams HH, Arkin A. Stochastic mechanisms in gene expression. Proc Natl Acad Sci USA. 1997;94:814–819. doi: 10.1073/pnas.94.3.814. - DOI - PMC - PubMed
    1. Koonin EV, Wolf YI, Aravind L. Prediction of the archaeal exosome and its connections with the proteasome and the translation and transcription machineries by a comparative-genomic approach. Genome Res. 2001;11:240–252. doi: 10.1101/gr.162001. - DOI - PMC - PubMed
    1. Evguenieva-Hackenberg E, Walter P, Hochleitner E, Lottspeich F, Klug G. An exosome-like complex in Sulfolobus solfataricus. EMBO Rep. 2003;4:889–893. doi: 10.1038/sj.embor.embor929. - DOI - PMC - PubMed

Publication types

MeSH terms