Cerebral blood flow and oxygenation in ovine fetus: responses to superimposed hypoxia at both low and high altitude
- PMID: 17068100
- PMCID: PMC2075128
- DOI: 10.1113/jphysiol.2006.119925
Cerebral blood flow and oxygenation in ovine fetus: responses to superimposed hypoxia at both low and high altitude
Abstract
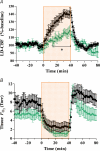
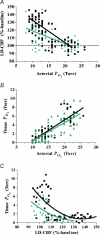
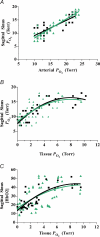
For the fetus, although the roles of arterial blood gases are recognized to be critical in the regulation of cerebral blood flow (CBF) and cerebral oxygenation, the relation of CBF, cortical tissue P(O2) (tP(O2)), sagittal sinus P(O2), and related indices of cerebral oxygenation to arterial blood gases are not well defined. This is particularly true for that fetus subjected to long-term hypoxia (LTH). In an effort to elucidate these interrelations, we tested the hypothesis that in the fetus acclimatized to high altitude, cerebral oxygenation is not compromised relative to that at low altitude. By use of a laser Doppler flowmeter with a fluorescent O2 probe, in near-term fetal sheep at low altitude (n = 8) and those acclimatized to high altitude hypoxia (3801 m for 90 +/- 5 days; n = 6), we measured laser Doppler CBF (LD-CBF), tP(O2), and related variables in response to 40 min superimposed hypoxia. At both altitudes, fetal LD-CBF, cerebral O2 delivery, tP(O2), and several other variables including sagittal sinus P(O2), correlated highly with arterial P(O2) (P(a,O2)). In response to superimposed hypoxia (P(a,O2) = 11 +/- 1 Torr), LD-CBF was significantly blunted at high altitude, as compared with that at low altitude. In the two altitude groups fetal cerebral oxygenation was similar under both control conditions and with superimposed hypoxia, cortical tP(O2) decreasing from 8 +/- 1 and 6 +/- 1 Torr, respectively, to 2 +/- 1 Torr. Also, for these conditions sagittal sinus P(O2) and [HbO2] values were similar. In response to superimposed hypoxia, cerebral metabolic rate for O(2) decreased approximately 50% in each group (P < 0.05). For both the fetus at low altitude and that acclimatized to high altitude LTH, we present the first dose-response data on the relation of LD-CBF, cortical tP(O2), and sagittal sinus blood gas values to P(a,O2). In addition, despite differences in several variables, the fetus at high altitude showed evidence of successful acclimatization, supporting the hypothesis that such fetuses demonstrate no compromise in cerebral oxygenation.
Figures


Similar articles
-
Fetal hypercapnia in high-altitude acclimatized sheep: cerebral blood flow and cerebral oxygenation.Reprod Sci. 2007 Jan;14(1):51-8. doi: 10.1177/1933719106298211. Reprod Sci. 2007. PMID: 17636216
-
Fetal cerebral blood flow, electrocorticographic activity, and oxygenation: responses to acute hypoxia.J Physiol. 2009 May 1;587(Pt 9):2033-47. doi: 10.1113/jphysiol.2009.166983. J Physiol. 2009. PMID: 19406885 Free PMC article.
-
Fetal hypercapnia and cerebral tissue oxygenation: studies in near-term sheep.Pediatr Res. 2006 Dec;60(6):711-6. doi: 10.1203/01.pdr.0000246308.37154.ce. Epub 2006 Oct 25. Pediatr Res. 2006. PMID: 17065566
-
Hypoxemia, oxygen content, and the regulation of cerebral blood flow.Am J Physiol Regul Integr Comp Physiol. 2016 Mar 1;310(5):R398-413. doi: 10.1152/ajpregu.00270.2015. Epub 2015 Dec 16. Am J Physiol Regul Integr Comp Physiol. 2016. PMID: 26676248 Free PMC article. Review.
-
Cerebral blood flow at high altitude.High Alt Med Biol. 2014 Jun;15(2):133-40. doi: 10.1089/ham.2013.1138. High Alt Med Biol. 2014. PMID: 24971767 Review.
Cited by
-
Cold Inducible RNA Binding Protein Is Involved in Chronic Hypoxia Induced Neuron Apoptosis by Down-Regulating HIF-1α Expression and Regulated By microRNA-23a.Int J Biol Sci. 2017 Apr 10;13(4):518-531. doi: 10.7150/ijbs.17800. eCollection 2017. Int J Biol Sci. 2017. PMID: 28529459 Free PMC article.
-
Maturation and the role of PKC-mediated contractility in ovine cerebral arteries.Am J Physiol Heart Circ Physiol. 2009 Dec;297(6):H2242-52. doi: 10.1152/ajpheart.00681.2009. Epub 2009 Sep 11. Am J Physiol Heart Circ Physiol. 2009. PMID: 19749163 Free PMC article.
-
Gestational Hypoxia and Developmental Plasticity.Physiol Rev. 2018 Jul 1;98(3):1241-1334. doi: 10.1152/physrev.00043.2017. Physiol Rev. 2018. PMID: 29717932 Free PMC article. Review.
-
Maturation and long-term hypoxia-induced acclimatization responses in PKC-mediated signaling pathways in ovine cerebral arterial contractility.Am J Physiol Regul Integr Comp Physiol. 2010 Nov;299(5):R1377-86. doi: 10.1152/ajpregu.00344.2010. Epub 2010 Aug 11. Am J Physiol Regul Integr Comp Physiol. 2010. PMID: 20702800 Free PMC article.
-
Antenatal hypoxia and pulmonary vascular function and remodeling.Curr Vasc Pharmacol. 2013 Sep;11(5):616-40. doi: 10.2174/1570161111311050006. Curr Vasc Pharmacol. 2013. PMID: 24063380 Free PMC article. Review.
References
-
- Aguan K, Murotsuki J, Gagnon R, Thompson LP, Weiner CP. Effect of chronic hypoxemia on the regulation of nitric-oxide synthase in the fetal sheep brain. Brain Res Dev Brain Res. 1998;111:271–277. - PubMed
-
- Ahmad R, Beharry K, Modanlou H. Changes in cerebral venous prostanoids during midazolam-induced cerebrovascular hypotension in newborn piglets. Crit Care Med. 2000;28:2429–2436. - PubMed
-
- Ashwal S, Majcher JS, Vain N, Longo LD. Patterns of fetal lamb regional cerebral blood flow during and after prolonged hypoxia. Pediat Res. 1980;14:1104–1110. - PubMed
-
- Bernstein IM, Horbar JD, Badger GJ, Ohlsson A, Golan A. Morbidity and mortality among very-low-birth-weight neonates with intrauterine growth restriction. The Vermont Oxford Network. Am J Obstet Gynecol. 2000;182:198–206. - PubMed
Publication types
MeSH terms
Substances
Grants and funding
LinkOut - more resources
Full Text Sources
Research Materials

