

Comparison of maximum entropy and filtered back-projection methods to reconstruct rapid-scan EPR images
- PMID: 17070083
- PMCID: PMC2744395
- DOI: 10.1016/j.jmr.2006.09.027
Comparison of maximum entropy and filtered back-projection methods to reconstruct rapid-scan EPR images
Abstract
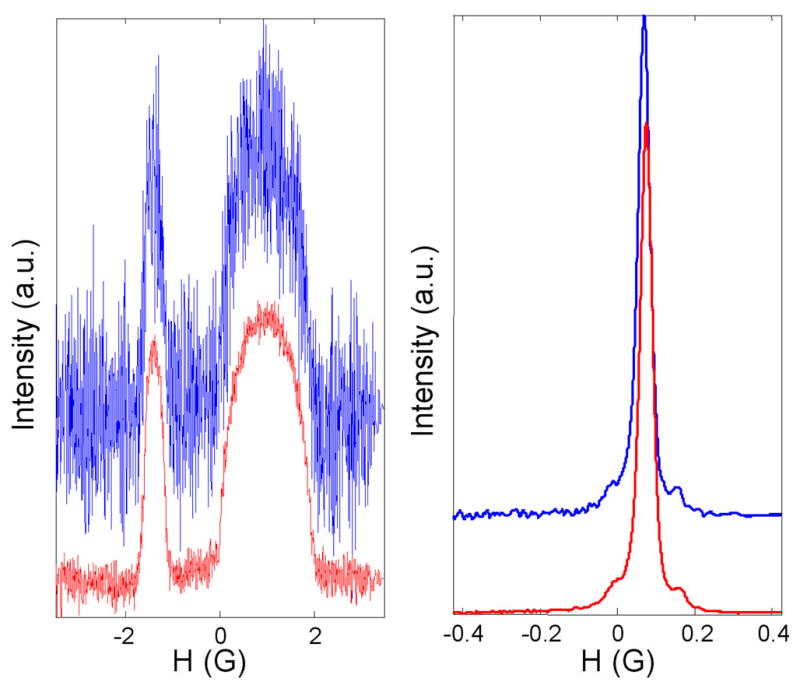
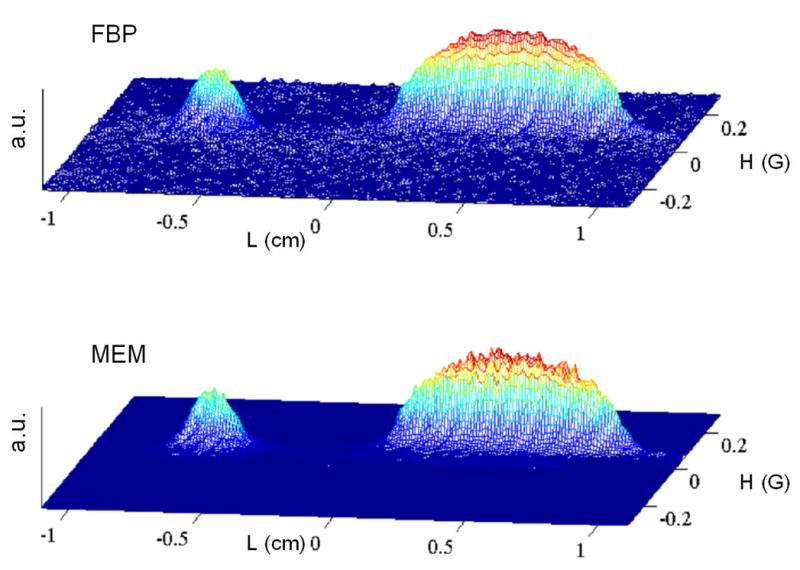
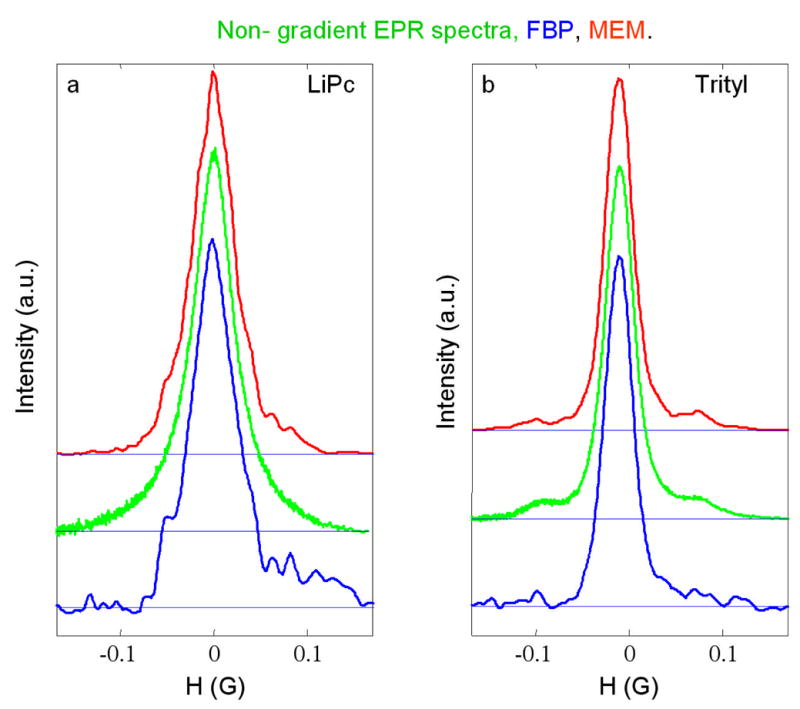
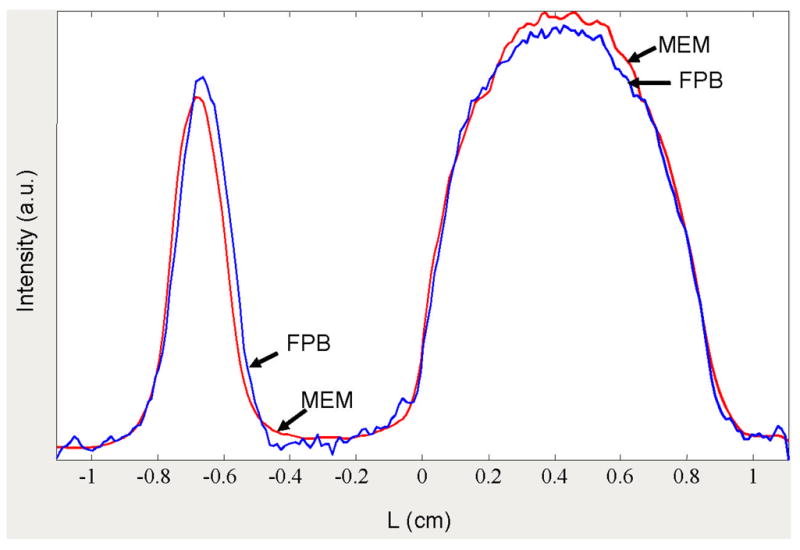
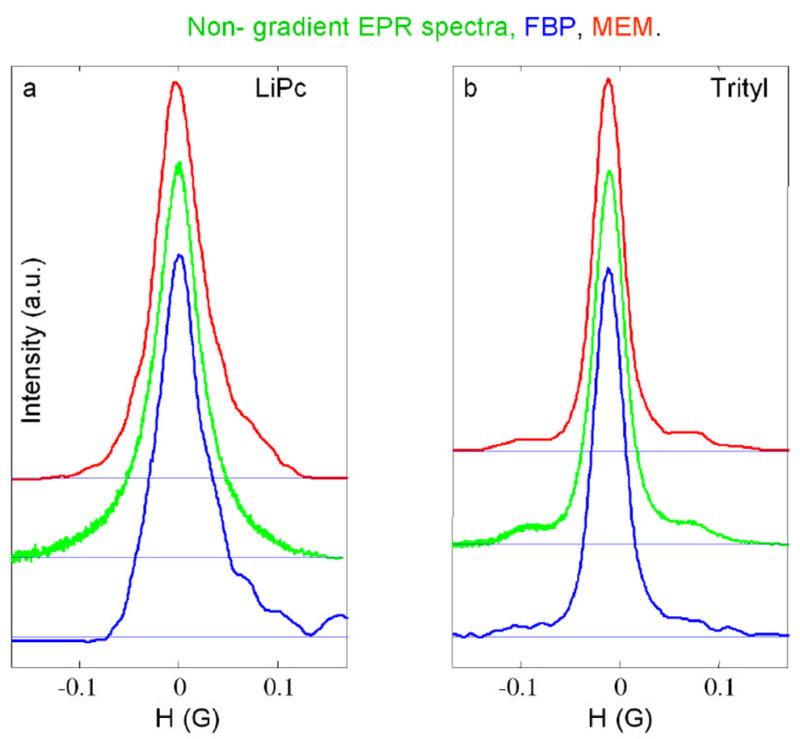
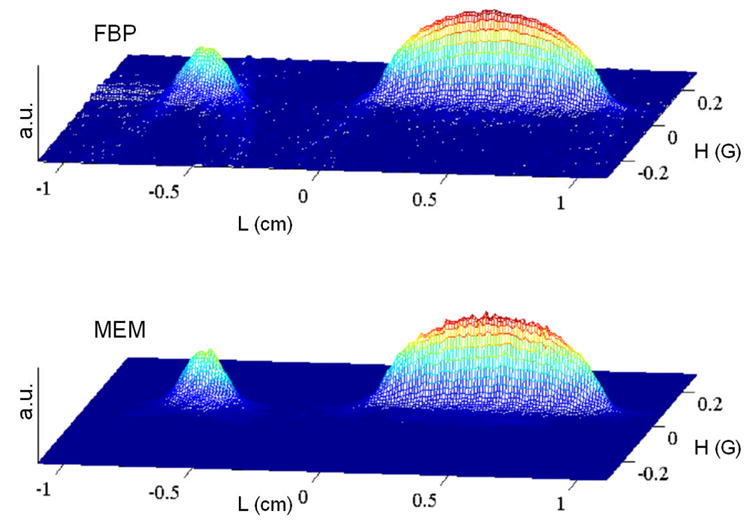
Reconstruction of two-dimensional images by filtered back-projection (FBP) and by the maximum entropy method (MEM) was compared for spectral-spatial EPR images with differing signal-to-noise ratios. Experimental projections were recorded using direct-detected rapid scans in the presence of a series of magnetic field gradients. The slow-scan absorption lineshapes were calculated by Fourier deconvolution. A Hamming filter was used in conjunction with FBP, but not for MEM. Imperfections in real experimental data, as well as random noise, contribute to discrepancies between the reconstructed image and experimental projections, which may make it impossible to achieve the customary MEM criterion for convergence. The Cambridge MEM algorithm, with allowance for imperfections in experimental data, produced images with more linear intensity scales and more accurate linewidths for weak signals than was obtained with another MEM method. The more effective elimination of noise in baseline regions by MEM made it possible to detect weak trityl (13)C trityl hyperfine lines that could not be distinguished from noise in images reconstructed by FBP. Another advantage of MEM is that projections do not need to be equally spaced. FBP has the advantages that computational time is less, the amplitude scale is linear, and there is less noise superimposed on peaks in images. It is useful to reconstruct images by both methods and compare results. Our observations indicate that FBP works well when the number of projections is large enough that the star effect is negligible. When there is a smaller number of projections, projections are unequally spaced, and/or signal-to-noise is lower MEM is advantageous.
Figures

References
-
- Herman GT. Image Reconstruction from Projections: Fundamentals of Computerized Tomography. Academic Press; New York: 1980.
-
- Kak AC, Slaney M. Principles of Computerized Tomographic Imaging. IEEE Press; New York: 1988.
-
- Hayner DA, Jenkins WK. The Missing Cone Problem in Computer Tomography. Adv Comp Vision and Image Proc. 1984;1:83–144.
-
- Maltempo MM, Eaton SS, Eaton GR. In: Algorithms for Spectral-Spatial Imaging with a “Missing Angle” in EPR Imaging and in vivo Spectroscopy. Eaton GR, Ohno K, Eaton SS, editors. CRC Press; Boca Raton, FL: 1991. pp. 145–152.
-
- Maltempo M, Eaton SS, Eaton GR. In: Spectral-Spatial Imaging in EPR Imaging and in vivo Spectroscopy. Eaton GR, Ohno K, Eaton SS, editors. CRC Press; Boca Raton, FL: 1991. pp. 135–144.
Publication types
MeSH terms
Grants and funding
LinkOut - more resources
Full Text Sources
Other Literature Sources
Medical
Miscellaneous
