. 2007 Jan 1;34(1):137-43.
doi: 10.1016/j.neuroimage.2006.09.011. Epub 2006 Oct 27.

Biological parametric mapping: A statistical toolbox for multimodality brain image analysis

Affiliations

Biological parametric mapping: A statistical toolbox for multimodality brain image analysis

Ramon Casanova et al. Neuroimage. .

Abstract

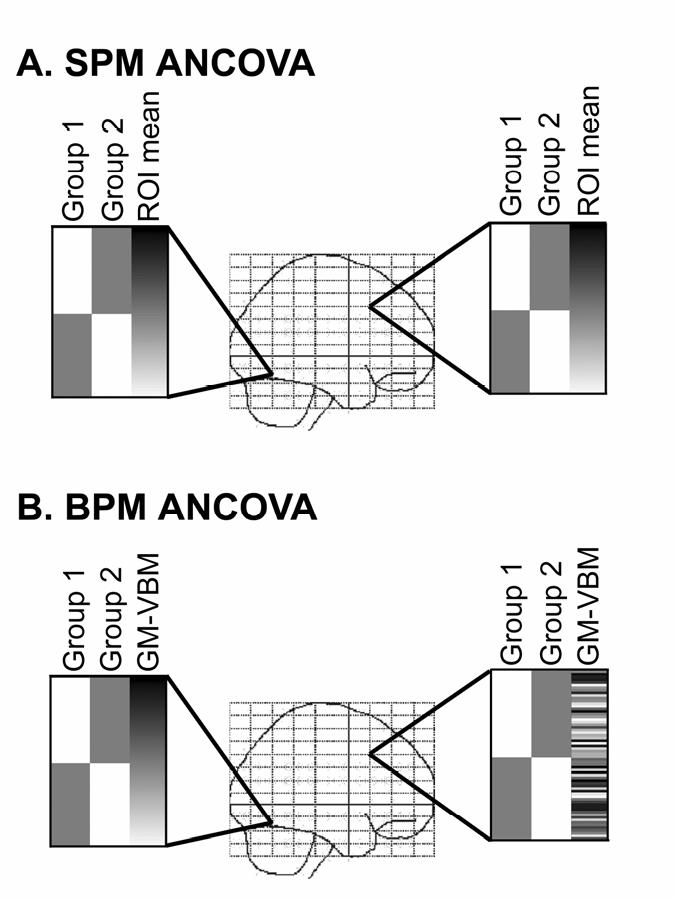
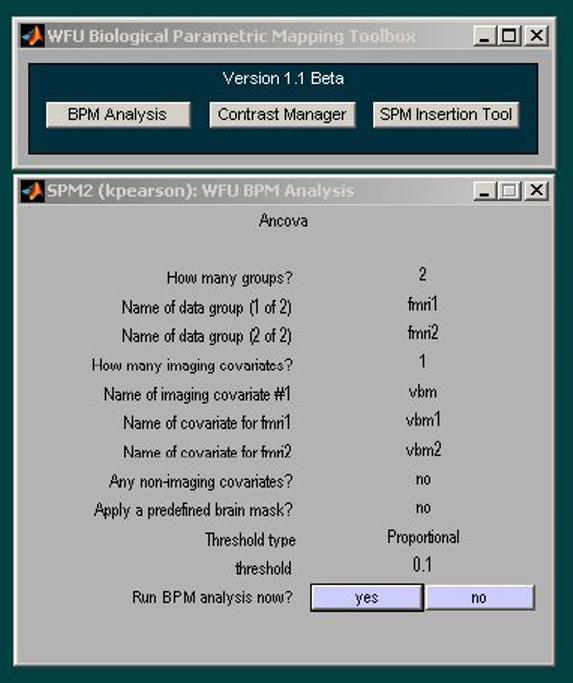
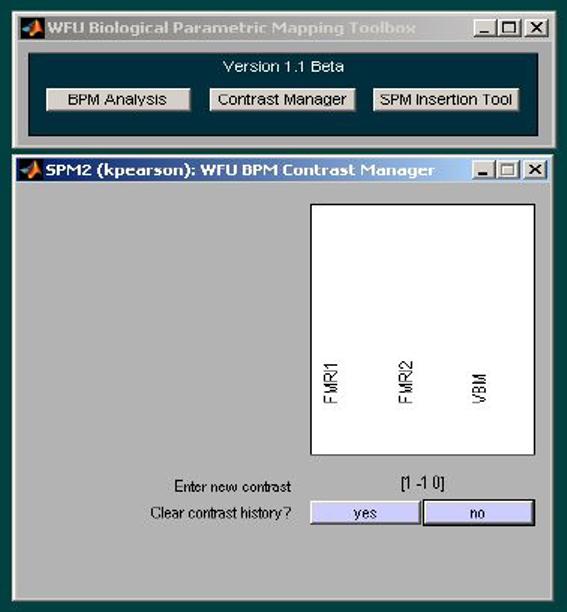
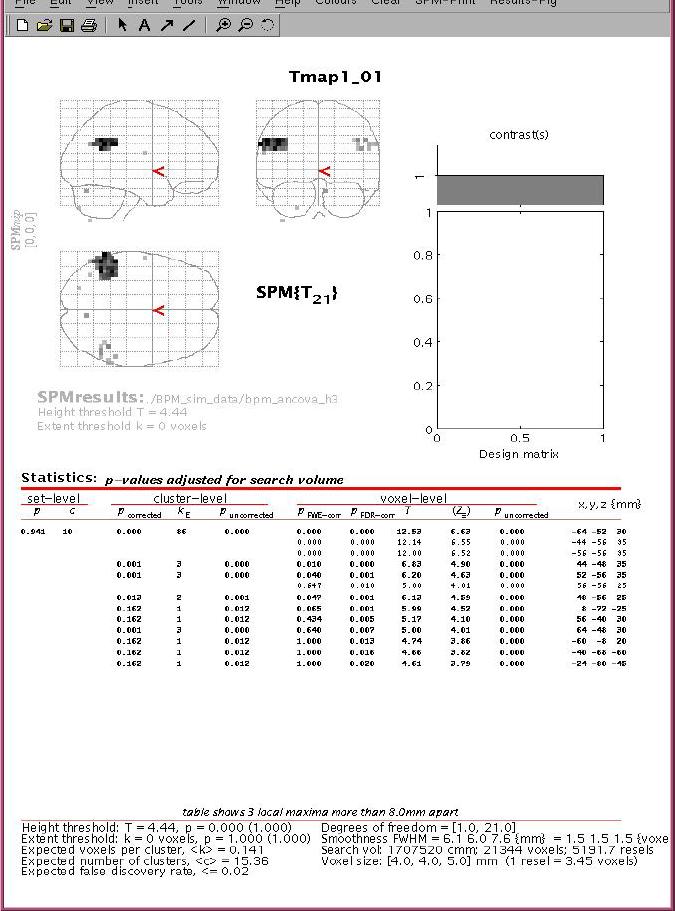
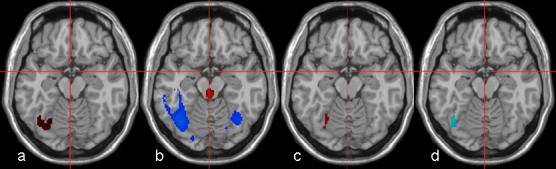
In recent years, multiple brain MR imaging modalities have emerged; however, analysis methodologies have mainly remained modality-specific. In addition, when comparing across imaging modalities, most researchers have been forced to rely on simple region-of-interest type analyses, which do not allow the voxel-by-voxel comparisons necessary to answer more sophisticated neuroscience questions. To overcome these limitations, we developed a toolbox for multimodal image analysis called biological parametric mapping (BPM), based on a voxel-wise use of the general linear model. The BPM toolbox incorporates information obtained from other modalities as regressors in a voxel-wise analysis, thereby permitting investigation of more sophisticated hypotheses. The BPM toolbox has been developed in Matlab with a user-friendly interface for performing analyses, including voxel-wise multimodal correlation, ANCOVA, and multiple regression. It has a high degree of integration with the SPM (statistical parametric mapping) software relying on it for visualization and statistical inference. Furthermore, statistical inference for a correlation field, rather than a widely used T-field, has been implemented in the correlation analysis for more accurate results. An example with in vivo data is presented, demonstrating the potential of the BPM methodology as a tool for multimodal image analysis.


Figures

Figure 1
Figure 1
BPM Design Matrix. In the hypothetical ANCOVA models demonstrated here the first 2 columns represent 2 hypothetical study populations and column 3 represents a nuisance regressor. This third column demonstrates the difference between a traditional SPM analysis and the BPM approach. A). In a standard SPM-style analysis all voxels have the same design matrix, where the nuisance regressor represents some scalar value (e.g. mean gray matter volume within an ROI). Note that the model is exactly the same in the different brain regions. B). In a BPM analysis, each voxel has a unique design matrix. In the example shown here, the values in column 3 represent the corresponding gray matter volume voxel-values. Since the gray matter volume values are different in various brain regions, the design matrix is unique at each voxel.
Figure 2
Figure 2
BPM GUI. The 3 main BPM GUI options are shown at the top. In this example, a BPM ANCOVA analysis was performed for 2 groups with a primary modality of fMRI and a single imaging covariate of VBM.
Figure 3
Figure 3
The BPM contrast widget provides a simple intuitive interface for entering user-defined contrasts. In this example, a contrast weight of (1 -1 0) is applied for FMRI group 1, FMRI group 2, and the VBM imaging covariate, respectively.
Figure 4
Figure 4
BPM T-map displayed in the SPM environment with SPM visualization and inference tools.
Figure 5
Figure 5
In-Vivo BPM results for a dyslexia study. Panel a represents ANOVA fMRI, panel b ANOVA VBM, panel c ANCOVA BPM, and panel d correlation analysis (all maps thresholded at p < 0.0025 uncorrected and displayed in neurologic convention). In panels a, b, and c, red and blue colors correspond to the contrasts (Dyslexic > Normal), (Normal>Dyslexic) respectively. In panel d, blue corresponds to negative association between fMRI and VBM. Left temporal activation (panel a) is regressed out after ANCOVA BPM (panel c). A negative association between the fMRI signal and local gray matter difference in the overlapping area is demonstrated in panel d (p<0.05 corrected for cluster-level using homologous correlation field).

Similar articles

Cited by

References

    1. Ashburner J, Friston KJ. Voxel-based morphometry-the methods. Neuroimage. 2000;11:805–821. - PubMed
    1. Automotive Industry Task Force (AIAG) Measurement Systems Analysis Reference Manual. Chrysler, Ford, General Motors Supplier Quality Requirements Task Force; 1994.
    1. Benjamini Y, Hochberg Y. Controlling the False Discovery Rate: A Practical and Powerful Approach to Multiple Testing. Journal of the Royal Statistical Society. 1995;57(1):289–300.
    1. Calhoun VD, Adali T, Giuliani NR, Pekar JJ, Kiehl KA, Pearlson GD. Method for Multimodal Analysis of Independent Source Differences in Schizophrenia: Combining Gray Matter Structural and Auditory Oddball Functional Data. Human Brain Mapping. 2006;27:47–62. - PMC - PubMed
    1. Cao J, Worsley KJ. The Geometry of Correlation Fields with an Application to Functional Connectivity of the Brain. Annals of Applied Probability. 1999;9:1021–1057.

Publication types