. 2006 Nov;169(5):1739-52.
doi: 10.2353/ajpath.2006.051222.

Preferential attachment of peritoneal tumor metastases to omental immune aggregates and possible role of a unique vascular microenvironment in metastatic survival and growth

Affiliations

Preferential attachment of peritoneal tumor metastases to omental immune aggregates and possible role of a unique vascular microenvironment in metastatic survival and growth

Scott A Gerber et al. Am J Pathol. 2006 Nov.

Abstract

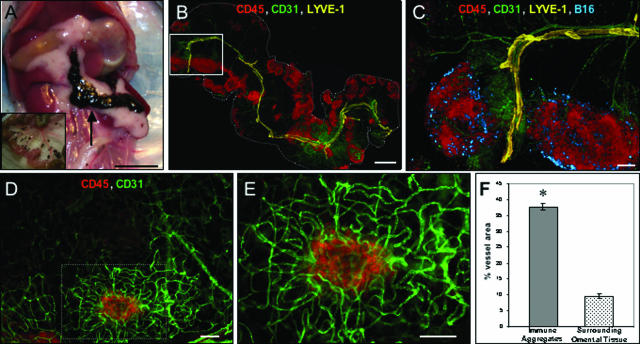
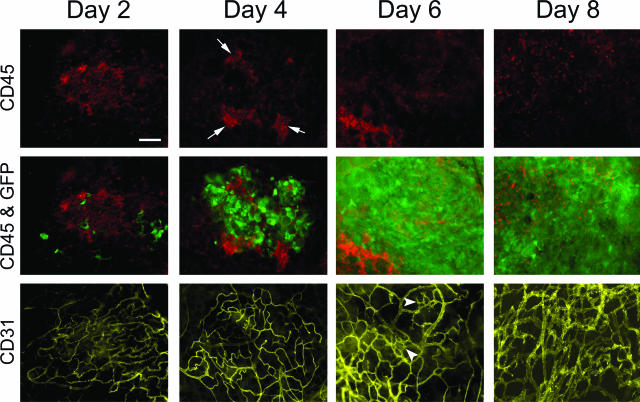
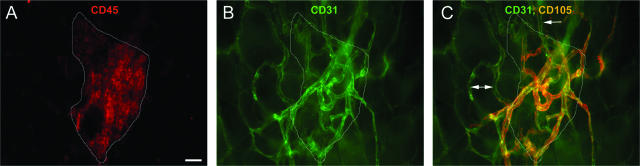
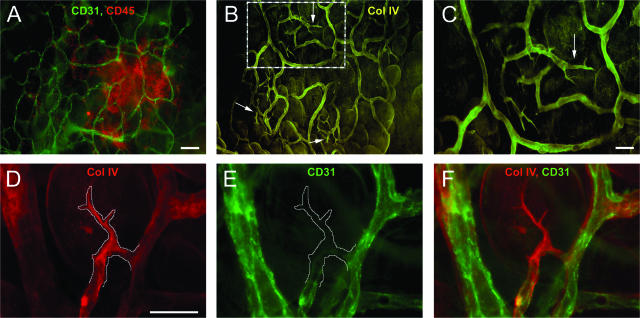
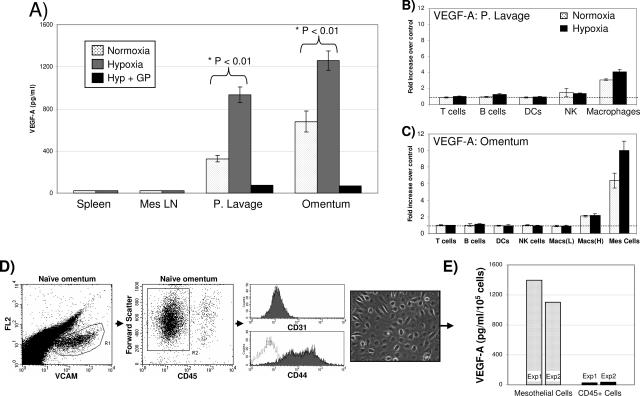
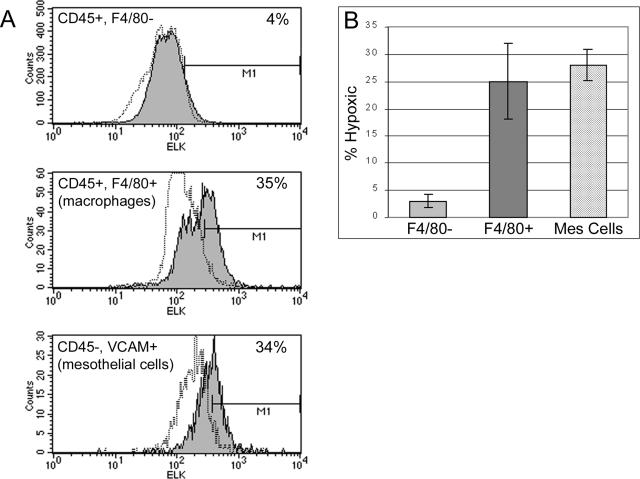
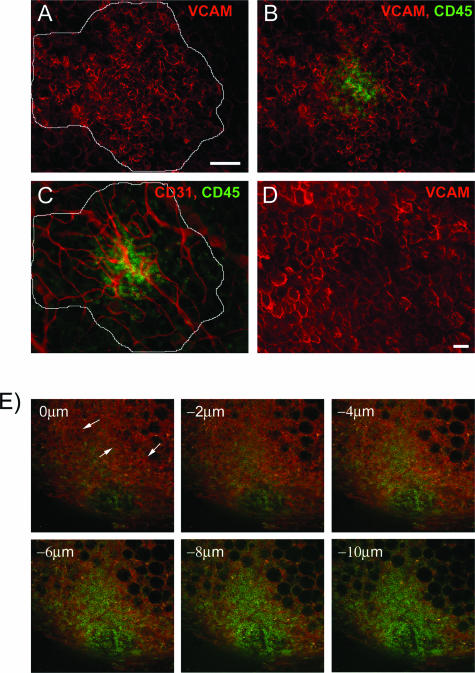
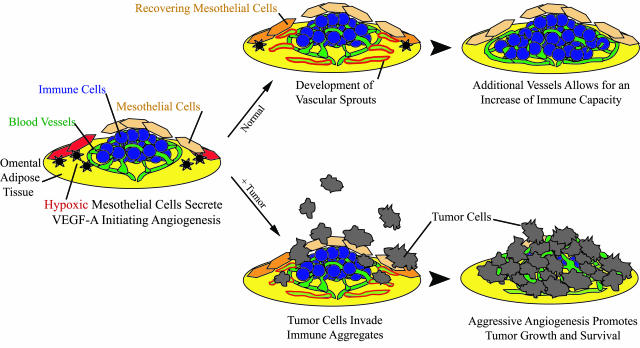
Controlling metastases remains a critical problem in cancer biology. Within the peritoneal cavity, omental tissue is a common site for metastatic disease arising from intraperitoneal tumors; however, it is unknown why this tissue is so favorable for metastatic tumor growth. Using five different tumor cell lines in three different strains of mice, we found that the omentum was a major site of metastases growth for intraperitoneal tumors. Furthermore, initial attachment and subsequent growth were limited to specific sites within the omentum, consisting of organized aggregates of immune cells. These immune aggregates contained a complex network of capillaries exhibiting a high vascular density, which appear to contribute to the survival of metastatic cells. We found that the vasculature within these aggregates contained CD105+ vessels and vascular sprouts, both indicators of active angiogenesis. A subset of mesothelial cells situated atop the immune aggregates was found to be hypoxic, and a similar proportion was observed to secrete vascular endothelial growth factor-A. These data provide a physiological mechanism by which metastatic tumor cells preferentially grow at sites rich in proangiogenic vessels, apparently stimulated by angiogenic factors produced by mesothelial cells. These sites provide metastatic cells with a microenvironment highly conducive to survival and subsequent growth.


Figures

Figure 1
Figure 1
Tumor cells attach to vascular dense immune aggregates on the omentum. A: The growth of tumor within the peritoneal cavity of a mouse injected intraperitoneally 6 days earlier with 2 × 10⁵ B16 tumor cells. The intestines were removed and are shown in the inset. B: An overview of the entire omentum from a mouse injected 10 hours earlier with 106 B16. The omentum was stained simultaneously with anti-CD45 to label immune cells (red), anti-CD31 to mark blood vessels (green), and anti-LYVE-1 (yellow) to identify lymphatic vessels. The tissue was prepared as a whole mount, viewed by fluorescence microscopy, and is shown as a montage overlay. C: Magnification of the white box, now including tumor cells (blue). D and E: An immune aggregate (anti-CD45-red) with a dense network of blood vessels (anti-CD31-green) (D) and at higher magnification (E). F: Image analysis of vascular density (percent vessel area) of the areas surrounding immune aggregates, such as the boxed area in D compared with surrounding areas. Images are representative of at least three independent experiments. *Significant at P < 0. 001 as determined by the Wilcoxon signed rank test. Scale bars: 1 cm (A); 1 mm (B); 200 μm (C); 100 μm (D, E).
Figure 2
Figure 2
Tumor cells infiltrate immune aggregates and exhibit rapid growth. B16/GFP tumor cells (1 × 10⁵) were injected intraperitoneally into mice. On the indicated days, omenta were removed and stained simultaneously with anti-CD45 to label immune cells (red) and anti-CD31 to mark blood vasculature (yellow) and visualized in separate fluorescence channels using whole mount microscopy. Images of the same field of view were taken on each day for immune cells alone (top), immune cells and GFP+ tumor cells shown as an overlay (middle), or blood vessels alone (bottom). Representative images from three separate experiments from each day are depicted. Arrowheads show morphological changes indicative of angiogenesis. Scale bar = 100 μm.
Figure 3
Figure 3
Vasculature within the immune aggregates specifically expresses the proangiogenic molecule CD105. A–C: Omenta were removed and stained simultaneously with anti-CD45 to label immune cells (red) (A), anti-CD31 to identify blood vessels (green) (B), and anti-CD105 (orange) shown as an overlay on blood vessels (C). An outline (white line) of the boundary of immune cells from A is also illustrated in B and C. Vessels outside of the aggregate were low or negative for CD105 expression (arrows). Images are representative of four independent experiments. Scale bar = 25 μm.
Figure 4
Figure 4
Definitive vascular sprouting can be observed within omental immune aggregates from naïve mice. A: Omenta were stained with anti-CD45 (red) or anti-CD31 (green) to demonstrate a typical immune aggregate consisting of immune cells and blood vessels, respectively. B: The same field of view stained simultaneously with anti-collagen type IV (yellow) identifying vascular sprouts near the boundaries of the aggregate vasculature (arrows). C: Higher magnification of the inset in B. In a separate immune aggregate, a more detailed examination of the vascular sprouts was performed on the same field of view in images D to F, illustrating anti-collagen type IV (red) staining with the sprout outlined (D), blood vessels lacking CD31 reactivity in the area of the sprout (white line) (E), and an overlay of both images (F). Images are representative from six independent experiments. Scale bars: 50 μm (A, B); 25 μm (C–F).
Figure 5
Figure 5
VEGF-A production by cell types found within the omentum or peritoneal cavity. A: Cells (1 × 10⁶) from the spleen, mesenteric LN, peritoneal lavage, or omentum were incubated in normoxic, hypoxic, or hypoxic plus brefeldin A (Golgi Plug, +GP) conditions for 16 hours, and VEGF-A in the supernatant was measured by ELISA. Subsets of cells from either the peritoneal cavity (B) or the omentum (C) were tested for VEGF-A production using intracellular staining and reported as the fold increase over controls as described in Materials and Methods. Cells not producing VEGF-A would have a fold increase of 1 (dotted line). Macrophages from the omentum were divided into those expressing low [Macs (L)] or high [Macs (H)] levels of F4/80. D: Phenotypic and morphological analysis of mesothelial cells isolated from single cell suspensions of the omentum. Gating on a population of VCAM+ cells (left dot plot) revealed this to be CD45 (middle dot plot). Further analysis of this VCAM+, CD45 population demonstrated the cells were CD31 (top histogram), and CD44+ (bottom histogram). The digital image is representative of these cells when grown in vitro after isolation by FACS (see below) showing a cobblestone morphology, which is typical of mesothelial cells. E: Mesothelial cells or CD45+ immune cells were sorted using flow cytometry and cultured in normoxic conditions, and VEGF-A production was measured after 16 hours of incubation as above. Each experiment described above was repeated at least three times with the exception of the sorted cells, which was done twice. Statistical significance was determined using a one-way analysis of variance followed by Bonferroni’s multiple comparison test.
Figure 6
Figure 6
Macrophages and mesothelial cells stain positively for the hypoxic marker EF5. Omental single-cell suspensions were obtained from mice treated with EF5 and stained with surface markers for macrophages (CD45+, F4/80+), mesothelial cells (CD45, VCAM+), and EF5 (ELK 3.51). Hypoxic fractions (shaded) were defined as the percent positive over no drug controls (dotted lines). A: Representative histograms are shown. B: Arithmetic means and SEM were calculated for each subset based on five (F4/80 and F4/80+ populations) or three (mesothelial cells) independent experiments. The percentage of hypoxic cells in the CD45+, F4/80 population is significantly different from both the CD45+, F4/80+ population and the mesothelial cells with P < 0.05 as determined by analysis of variance and Bonferroni’s multiple comparison test.
Figure 7
Figure 7
VCAM+ mesothelial cells have a defined patchy architecture over the immune aggregate. Mesothelial cells were identified within immune aggregates using anti-VCAM (red) (A), and their outer boundary was traced. In B, immune cells labeled with anti-CD45 (green) and mesothelial cells (red) are shown as an overlay. C: Within the same field of view, immune cells and blood vessels labeled with anti-CD31 (red) are shown as an overlay with the boundary of the mesothelial cells shown in white. D: A higher magnification of mesothelial cells from a different immune aggregate illustrating large, cobblestone-like cells. E: Confocal analysis of an immune aggregate stained for immune cells (green) and mesothelial cells (orange). Descending confocal slices (0 to 10 μm) of the immune aggregate with mesothelial cells (arrows) visible near the top of the aggregate. Conventional microscopy experiments were repeated three times, whereas confocal experiments were preformed twice. Scale bars: 100 μm (A–C); 25 μm (D).
Figure 8
Figure 8
Proposed model. As described, omental immune aggregates contain mesothelial cells, some of which are hypoxic (red) and therefore secrete VEGF-A (black asterisks). In a normal physiological setting (top), VEGF-A production can stimulate blood vessels to produce vascular sprouts (green outlined in red), resulting in the induction of angiogenesis and recovery of once-hypoxic mesothelial cells. The increase of vessels delivers more immune cells, along with additional oxygen and nutrients necessary to support the influx of cells. In a metastasis model (bottom), tumor cells invade aggregates and co-opt the existing dense vasculature. Because angiogenesis is already induced, new blood vessel formation is rapid, resulting in aggressive tumor growth.

References

    1. Mahteme H, Hansson J, Berglund A, Pahlman L, Glimelius B, Nygren P, Graf W. Improved survival in patients with peritoneal metastases from colorectal cancer: a preliminary study. Br J Cancer. 2004;90:403–407. - PMC - PubMed
    1. Healy JC, Reznek RH. The peritoneum, mesenteries and omenta: normal anatomy and pathological processes. Eur Radiol. 1998;8:886–900. - PubMed
    1. Buy JN, Moss AA, Ghossain MA, Sciot C, Malbec L, Vadrot D, Paniel BJ, Decroix Y. Peritoneal implants from ovarian tumors: CT findings. Radiology. 1988;169:691–694. - PubMed
    1. Sheth S, Horton KM, Garland MR, Fishman EK. Mesenteric neoplasms: CT appearances of primary and secondary tumors and differential diagnosis. Radiographics. 2003;23:435–473. - PubMed
    1. Lawrance RJ, Loizidou M, Cooper AJ, Alexander P, Taylor I. Importance of the omentum in the development of intra-abdominal metastases. Br J Surg. 1991;78:117–119. - PubMed

Publication types

MeSH terms

Substances