. 2006 Nov;169(5):1802-11.
doi: 10.2353/ajpath.2006.060006.

Individual cell-based models of tumor-environment interactions: Multiple effects of CD97 on tumor invasion

Affiliations

Individual cell-based models of tumor-environment interactions: Multiple effects of CD97 on tumor invasion

Joerg Galle et al. Am J Pathol. 2006 Nov.

Abstract

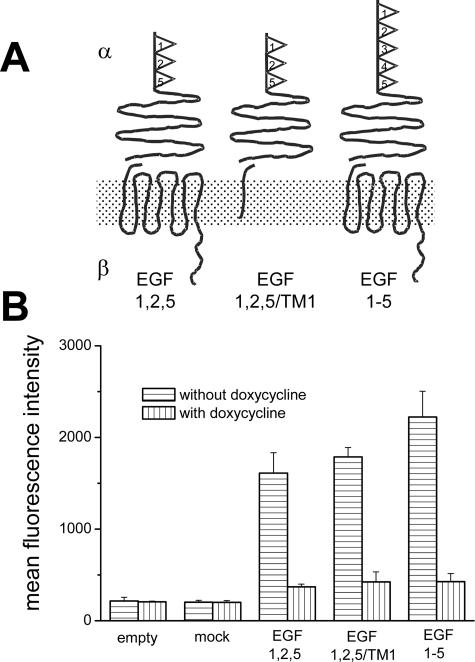
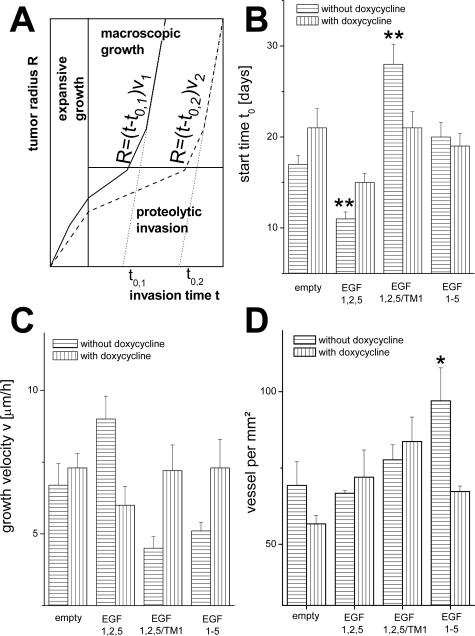
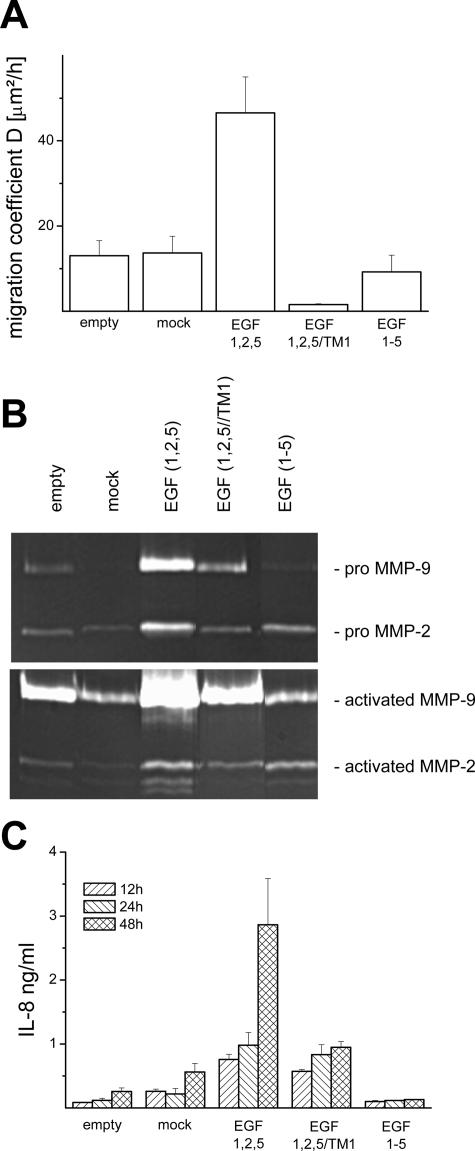
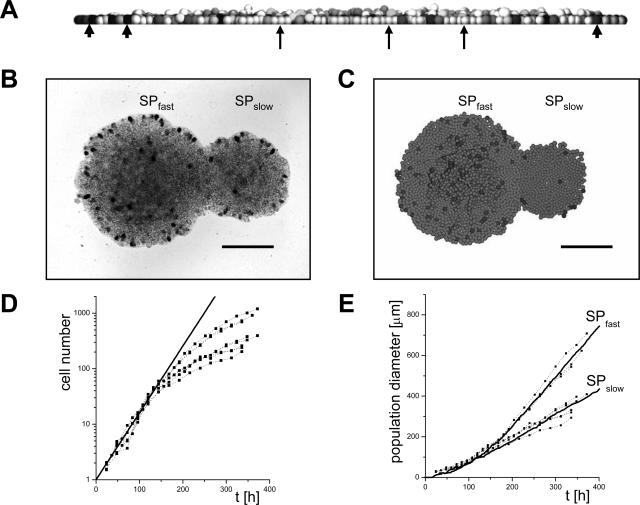
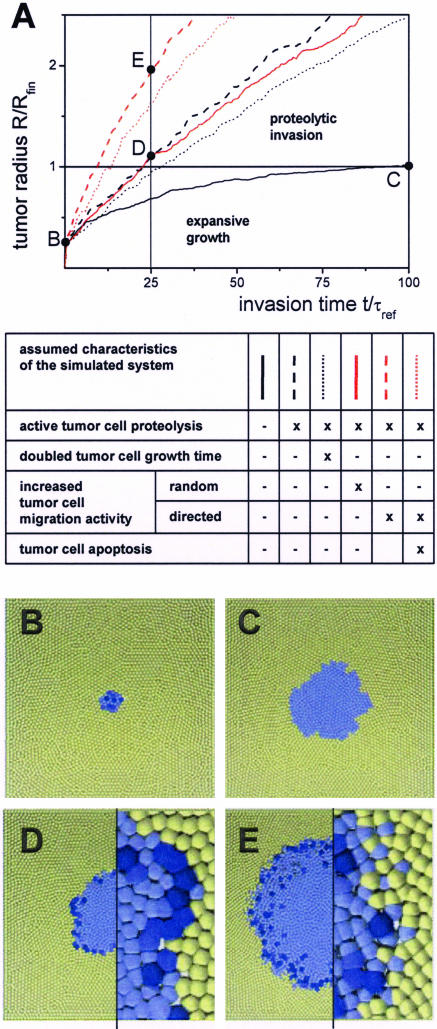
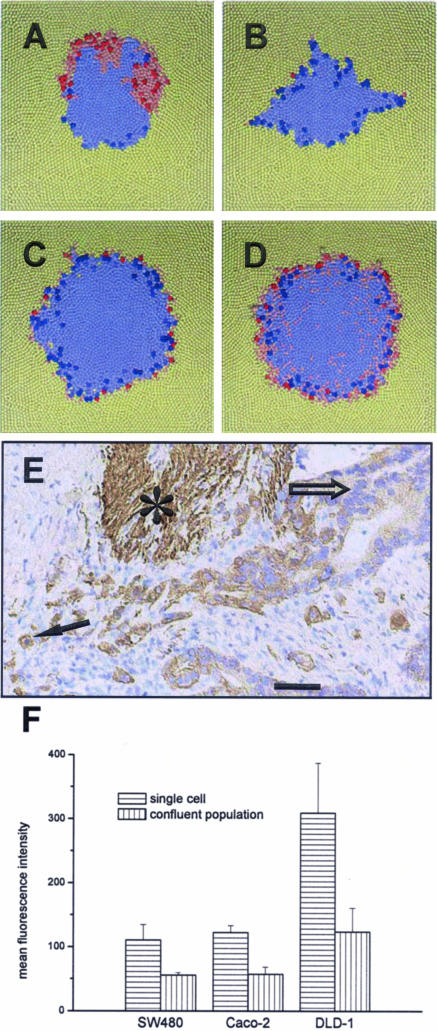
The presence of scattered tumor cells at the invading front of several carcinomas has clinical significance. These cells differ in their protein expression from cells in central tumor regions as recently shown for the EGF-TM7 receptor CD97. To understand the impact of such heterogeneity on tumor invasion, we investigated tumor cells with modified CD97 expression in vitro and in vivo. Applying an individual cell-based computer model approach, we linked specific cell properties of these cells to tumor invasion characteristics. CD97 overexpression promoted tumor growth in scid mice, stimulated single cell motility, increased proteolytic activity of matrix metalloproteinases, and secretion of chemokines in vitro in an isoform-specific manner. We demonstrated by computer simulation studies that these effects of CD97 can increase the invasion capacity of tumors. Furthermore, they can cause the appearance of scattered tumor cells at the invasion front. We identified local tumor environment interactions as triggers of these multiple capabilities. Experimentally, our simulation results are supported by the finding that CD97 expression in tumor cells is regulated by their environment. Our combined experimental-theoretical analysis provides novel insight to how variations of individual cell properties can be linked to individual patterns of tumor cell invasion.


Figures

Figure 1
Figure 1
CD97 clones. A: Schematic structure of stably expressed CD97 molecules in HT1080 cells. CD97 consists of an α and β chain that are noncovalently bound. The CD97 (EGF 1,2,5) and CD97 (EGF 1-5) isoforms differ in their number of extracellular EGF domains. CD97 (EGF 1,2,5/TM1) is truncated within the first transmembrane domain. B: In vitro CD97 expression levels of the HT1080 clones cultured with and without doxycycline determined by flow cytometry (mean ± SEM, n = 3).
Figure 2
Figure 2
In vivo tumor growth. A: Sketch of a simplified model of tumor propagation in scid mice. An initial expansive growth phase is followed by a phase of proteolytic invasion. After releasing strong tissue confinements, a phase of rapid macroscopic growth starts. The phases are shown for two tumors (tumors 1 and 2), in which tumor 1 (solid line) is more invasive. B and C: Estimated tumor growth parameters. B: Starting time t0; C: growth velocity v derived from a linear fit to the tumor radius R = (tt0)v in the phase of macroscopic growth (n = 8, mean ± SEM). D: Microvessel density determined by CD31 staining in histological sections of various HT1080 tumors (n = 8, mean ± SEM). Significance of a change compared with the empty control system: *P < 0.05, **P < 0.01; Westfall-Young test.
Figure 3
Figure 3
In vitro properties of the HT-1080 clones. A–C: Single cell properties of HT1080 clones cultured without doxycycline. CD97 (EGF 1,2,5) stimulates single cell motility and increases proteolytic activity of matrix metalloproteinases and chemokine secretion. A: Single cell migration coefficients calculated for a time span of 12 hours (n = 9, mean ± SEM). B: Gelatin zymograms of supernatants of unstimulated (top row) and TNF-α-stimulated (bottom row) HT1080 clones. C: Time-dependent basal IL-8 secretion (n = 3, mean ± SEM).
Figure 4
Figure 4
Experimental and computer-simulated colony growth. A: Vertical section through a growing computer model population. The gray value of the cells is a marker of the cell volume. Black cells (arrowheads) are in the act of starting division; white cells (arrows) underwent contact inhibition of growth; ie, they are quiescent because of compression by neighboring cells. B: Top view on two cultured Widr empty control populations after 14 days stained for proliferation by BrdU. They grow from cells of different subpopulations (SPfast, SPslow). C: Computer simulation results related to B. D: Cell number of CD97 (EGF 1,2,5)-transfected Widr cell colonies versus time t. The thick line indicates exponential growth according to a cell doubling time of 25 hours. E: Diameter of the colonies shown in D. Lines are computer simulation results applying the parameter sets of Widr empty control cells for SPfast and SPslow and considering the doubling time of the transfected cells. Scale bars = 200 μm.
Figure 5
Figure 5
Computer model results on tumor invasion. A: Effects of tumor cell properties on invasion dynamics. The tumor radius R is scaled with the finite tumor radius Rfin obtained without stroma degradation (black solid line); the time t with the reference cell growth time τref of 21 hours. B–E: Snapshots of computer-simulated tumors at the selected times points indicated in A. Tumor cells are blue; stroma cells are yellow. Color saturation indicates immanent cell division. Without proteolytic activity of the tumor cells (A, black solid line) tumor expansion starting from a small initial tumor (B) stops because of contact inhibition of growth after ∼100 τref (C). Proteolytic activity of the tumor cells (A, black dashed line) enables persistent tumor invasion. Thus, the tumor radius reaches the value of Rfin already after ∼25 τref (D). The invasion is only moderately slowed, doubling the tumor cell growth time τ (A, black dotted line). In contrast to enhanced random migration (A, red solid line), enhanced directed migration in the presence of active proteolysis (A, red dashed line) strongly promotes invasion by roughening the proteolytic active interface (compare magnifications in D and E). Regardless of that large interface, stroma contact-induced tumor cell apoptosis has only weak effects on invasion (A, red dotted line). Box height: 800 μm (B–E); magnifications; 160 μm (D, E).
Figure 6
Figure 6
On the origin of increased CD97 expression in scattered tumor cells at the invasion front of colorectal carcinoma. Top view on computer model systems after an invasion time of 25 reference cell growth times of 21 hours. Altered cells (red) are characterized by a four times increased migration coefficient and a directed migration at the tumor invasion front. Saturated color indicates imminent cell division. A: Invasion after a mutation (stable alteration) of a single cell. The clone of that cell has spread partially throughout the tumor front. B–D: Invasion considering regulated alteration. Tumor cells become altered if the number of tumor cell neighbors falls below two (B), four (C), and six (D), respectively. Accordingly, altered cells occur at the tumor front. This corresponds to the expression of CD97 found in colorectal carcinoma (E). Stronger expression of CD97 is found in scattered tumor cells or tumor cell groups (arrow) surrounded by stroma compared with tumor cells located in tumor glands or solid tumor trabecula (open arrow). Smooth muscle cells (asterisk) also express CD97. F: CD97 expression in colorectal carcinoma cell lines, here shown for SW480, Caco-2, and DLD-1 cells, forming confluent layers is significantly decreased compared with that in single cell cultures of the same cell type as shown by flow cytometry (mean ± SEM, n = 3). The result does not depend on absolute CD97 expression levels. Box height, 800 μm (A–D). Scale bar = 50 μm.

References

    1. Thiery JP. Epithelial-mesenchymal transitions in tumor progression. Nat Rev Cancer. 2002;2:442–454. - PubMed
    1. Bates RC, Mercurio AM. The epithelial-mesenchymal transition (EMT) and colorectal cancer progression. Cancer Biol Ther. 2005;4:365–370. - PubMed
    1. LaGamba D, Nawshad A, Hay ED. Microarray analysis of gene expression during epithelial-mesenchymal transformation. Dev Dyn. 2005;234:132–142. - PubMed
    1. Balkwill F. Cancer and the chemokine network. Nat Rev Cancer. 2004;4:540–550. - PubMed
    1. Bates RC, DeLeo MJ, III, Mercurio AM. The epithelial-mesenchymal transition of colon carcinoma involves expression of IL-8 and CXCR-1-mediated chemotaxis. Exp Cell Res. 2004;299:315–324. - PubMed

Publication types

LinkOut - more resources