. 2006 Nov;169(5):1863-74.
doi: 10.2353/ajpath.2006.060265.

Invasive trophoblasts stimulate vascular smooth muscle cell apoptosis by a fas ligand-dependent mechanism

Affiliations

Invasive trophoblasts stimulate vascular smooth muscle cell apoptosis by a fas ligand-dependent mechanism

Lynda K Harris et al. Am J Pathol. 2006 Nov.

Abstract

During pregnancy, trophoblasts migrate from the placenta into uterine spiral arteries, transforming them into wide channels that lack vasoconstrictive properties. In pathological pregnancies, this process is incomplete. To define the fundamental events involved in spiral artery remodeling, we have studied the effect of trophoblasts on vascular smooth muscle cells (SMCs). Here we demonstrate for the first time that apoptosis of SMCs can be initiated by invading trophoblasts. When trophoblasts isolated from normal placenta (primary trophoblasts) or conditioned medium was perfused into spiral or umbilical artery segments, apoptosis of SMCs resulted. Culture of human aortic SMCs (HASMCs) with primary trophoblasts, primary trophoblast-conditioned medium, or a trophoblast-derived cell line (SGHPL-4) also significantly increased SMC apoptosis. Fas is expressed by spiral artery SMCs, and a Fas-activating antibody triggered HASMC apoptosis. Furthermore, a Fas ligand (FasL)-blocking antibody significantly inhibited HASMC apoptosis induced by primary trophoblasts, SGHPL-4, or trophoblast-conditioned medium. Depleting primary trophoblast-conditioned medium of FasL also abrogated SMC apoptosis in vessels in situ. These results suggest that apoptosis triggered by the release of soluble FasL from invading trophoblasts contributes to the loss of smooth muscle from the walls of spiral arteries during pregnancy.


Figures

Figure 1
Figure 1
Trophoblasts induce apoptosis of arterial SMCs in situ. A: Spiral artery (minus endothelium) perfused with primary CTB for 48 hours and stained with an antibody against cytokeratin-7 (green). B–D: Spiral artery (minus endothelium) perfused with control medium, 24 hours (B); primary CTB, 24 hours (C); primary CTB-conditioned medium [50% (v/v)], 24 hours (D). TUNEL-positive cells are labeled with FITC (green). Nuclei are counterstained with propidium iodide (red). *Vessel lumen. Pictures are representative of n ≥ 3 independent experiments, with each experiment performed on vessels from a different biopsy. Scale bars = 100 μm.
Figure 2
Figure 2
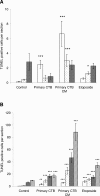
Trophoblast-induced SMC apoptosis in an ex vivo vessel model. Spiral arteries or umbilical arteries were denuded of endothelium, perfused with control culture medium, primary CTB, primary CTB-conditioned medium [50% (v/v)], or control medium containing etoposide (10 μmol/L) and tied off. Some vessels were frozen immediately (0 hours), and others were cultured and frozen after 24 hours (open bars), 48 hours (stippled bars), 72 hours (shaded bars), or 96 hours (umbilical arteries only, hatched bars). After cryosectioning, the number of TUNEL-positive SMCs per vessel section was quantified by fluorescence microscopy (excluding cells in the two tissue layers closest to the lumen). A: Spiral arteries [mean ± SEM, n = 3 vessels from individual biopsies (primary CTB-conditioned medium, etoposide); n = 4 vessels from individual biopsies (control, primary CTB)]. Six sections were counted per vessel. *P < 0.05, **P < 0.01, and ***P < 0.001, versus control vessel at corresponding time point, paired Student’s t-test. B: Umbilical arteries (mean ± SEM, n = 5 vessels from individual cords).
Figure 3
Figure 3
Time course of HASMC death induced by trophoblasts in co-culture. A: A representative series of images captured from time-lapse microscopy of a single HASMC showing the morphological changes associated with apoptosis. HASMCs undergo cytoplasmic shrinkage and nuclear condensation associated with a change in the refractive index (phase bright appearance). Characteristic membrane blebs (23 hours) and blisters (24 hours) appear. B and C: Contact co-cultures of HASMCs alone (▴, •) or HASMCs and primary CTBs (▵) (B) or the extravillous trophoblast-derived cell line SGHPL-4 (○) (C), were monitored by time-lapse microscopy. HASMC apoptosis was determined by scoring 40 cells and recording the time point at which they underwent apoptosis. B: Time course of primary CTB-induced HASMC apoptosis. The inset bar graph shows the percentage of apoptotic HASMCs at 60 hours, *P < 0.05, paired t-test. C: Time course of SGHPL-4-induced HASMC apoptosis. The inset bar graph shows the percentage of apoptotic HASMCs at 60 hours, *P < 0.005, paired t-test (mean ± SEM, n = 3 independent primary CTB isolations; n = 7 independent SGHPL-4 cultures).
Figure 4
Figure 4
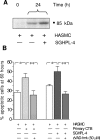
HASMC death induced by trophoblasts in co-culture occurs by apoptosis. A: Noncontact co-cultures of HASMCs alone or HASMCs and the extravillous trophoblast-derived cell line SGHPL-4 (added in transwells) were established. Apoptosis was assessed at 24 hours by immunoblot analysis of cleaved PARP expression. A representative autoradiograph from n = 4 experiments is shown. B: Contact co-cultures of HASMCs alone (open bars) or HASMCs and primary CTBs (light shading) or the extravillous trophoblast-derived cell line SGHPL-4 (dark shading), were treated with the pan-caspase inhibitor zVAD-fmk (50 μmol/L) and then monitored by time-lapse microscopy. HASMC apoptosis was determined by scoring 40 cells and recording the time point at which they underwent apoptosis. The percentage of apoptotic HASMCs at 60 hours is shown, *P < 0.05 and **P < 0.05 (primary CTB) and *P < 0.05 and **P < 0.001 (SGHPL-4), repeated measures analysis of variance (mean ± SEM, n = 6 independent primary CTB isolations; n = 5 independent SGHPL-4 cultures).
Figure 5
Figure 5
Activation of Fas on HASMCs induces apoptosis. A–C: Confocal images of cultured HASMCs stained for Fas expression. A: Composite Z-stack. B: One Z-slice from the center of the Z-stack. C: Negative control (IgG). D: HASMCs were treated with a Fas-activating antibody (anti-human CD95) and then monitored by time-lapse microscopy. HASMC apoptosis was determined by scoring 40 cells and recording the time point at which they underwent apoptosis. The percentage of apoptotic HASMCs at 60 hours is shown, *P < 0.05 and **P < 0.001, repeated measures analysis of variance (mean ± SEM, n = 5 independent SMC cultures). E: HASMCs were treated with a Fas-activating antibody (1 μg/ml). Apoptosis was assessed at 24 and 60 hours by immunoblot analysis of the expression of cleaved PARP. The dividing line represents where unrelated lanes have been cropped from the image. A representative autoradiograph from n = 4 experiments is shown. Scale bar = 20 μm.
Figure 6
Figure 6
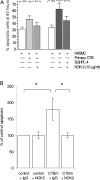
Trophoblast-induced HASMC apoptosis is inhibited by a Fas ligand-blocking antibody. A: Contact co-cultures of HASMCs alone (open bars) or HASMCs and primary CTBs (light shading) or the extravillous trophoblast-derived cell line SGHPL-4 (dark shading) were treated with a Fas ligand-blocking antibody (NOK-2) and monitored by time-lapse microscopy. HASMC apoptosis was determined by scoring 40 cells and recording the time point at which they underwent apoptosis. The percentage of apoptotic HASMCs at 60 hours is shown, *P < 0.001 and **P < 0.001 (primary CTB) and *P < 0.05 and **P < 0.001 (SGHPL-4), repeated measures analysis of variance (mean ± SEM, n = 7 independent primary CTB isolations; n = 5 independent SGHPL-4 cultures). B: HASMCs were incubated with serum-free unconditioned trophoblast medium (control) or serum-free primary CTB-conditioned medium [CM; 50% (v/v); both pretreated with NOK-2 or an IgG isotype control (10 μg/ml, 1 hour)] for 2 hours. The percentage of cells externalizing phosphatidylserine was quantified using flow cytometry. *P < 0.05, paired Student’s t-test (mean ± SEM, n = 4 independent SMC cultures).
Figure 7
Figure 7
SMC apoptosis in vessel segments perfused with primary CTB-conditioned medium is inhibited with a Fas ligand blocking antibody. Spiral arteries or umbilical arteries were denuded of endothelium and perfused with serum-free unconditioned culture medium (control), or serum-free primary CTB-conditioned medium [CM, 50% (v/v)], that had been pretreated with the anti-FasL antibody NOK-2 or a control IgG (10 μg/ml, 1 hour). The number of TUNEL-positive SMCs per vessel section was quantified by fluorescence microscopy. Nine sections were counted per vessel. Spiral arteries (open bars) were analyzed after 24 hours in culture. Umbilical arteries (shaded bars) were analyzed after 72 hours in culture. ***P < 0.001, repeated measures analysis of variance (mean ± SEM, n = 4 vessels obtained from individual biopsies or umbilical cords).

References

    1. Benirschke K, Kaufmann P. New York: Springer,; Pathology of the Human Placenta. 2000:pp 217–226.
    1. Khong TY, De Wolf F, Robertson WB, Brosens I. Inadequate maternal vascular response to placentation in pregnancies complicated by pre-eclampsia and by small-for-gestational age infants. Br J Obstet Gynaecol. 1986;93:1049–1059. - PubMed
    1. Pijnenborg R, Anthony J, Davey DA, Rees A, Tiltman A, Vercruysse L, van Assche A. Placental bed spiral arteries in the hypertensive disorders of pregnancy. Br J Obstet Gynaecol. 1991;98:648–655. - PubMed
    1. Kadyrov M, Schmitz C, Black S, Kaufmann P, Huppertz B. Pre-eclampsia and maternal anaemia display reduced apoptosis and opposite invasive phenotypes of extravillous trophoblast. Placenta. 2003;24:540–548. - PubMed
    1. Naicker T, Khedun SM, Moodley J, Pijnenborg R. Quantitative analysis of trophoblast invasion in preeclampsia. Acta Obstet Gynecol Scand. 2003;82:722–729. - PubMed

Publication types