

tie-dyed1 Regulates carbohydrate accumulation in maize leaves
- PMID: 17071639
- PMCID: PMC1676051
- DOI: 10.1104/pp.106.090381
tie-dyed1 Regulates carbohydrate accumulation in maize leaves
Abstract
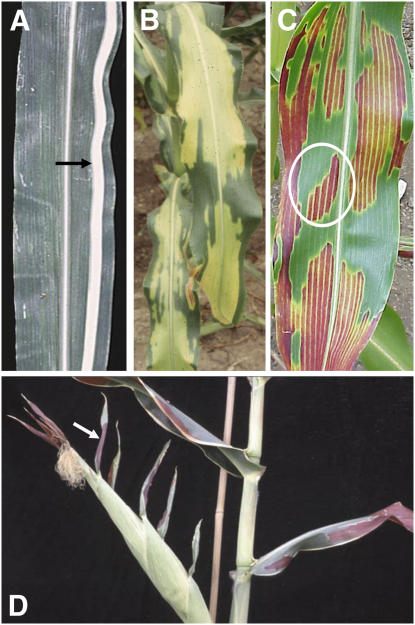
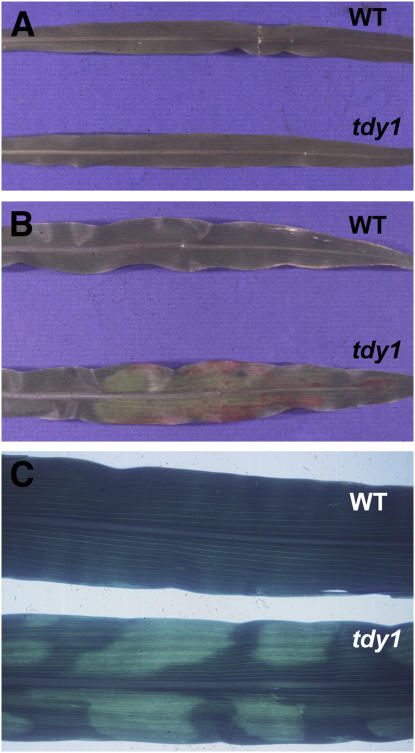
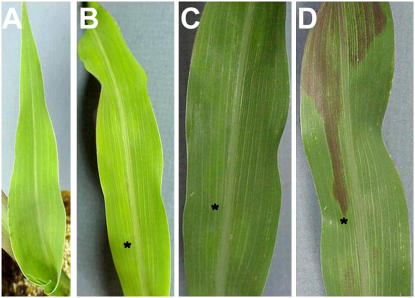
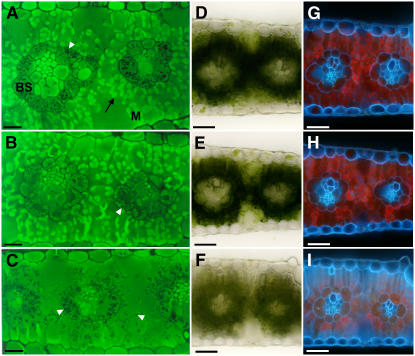
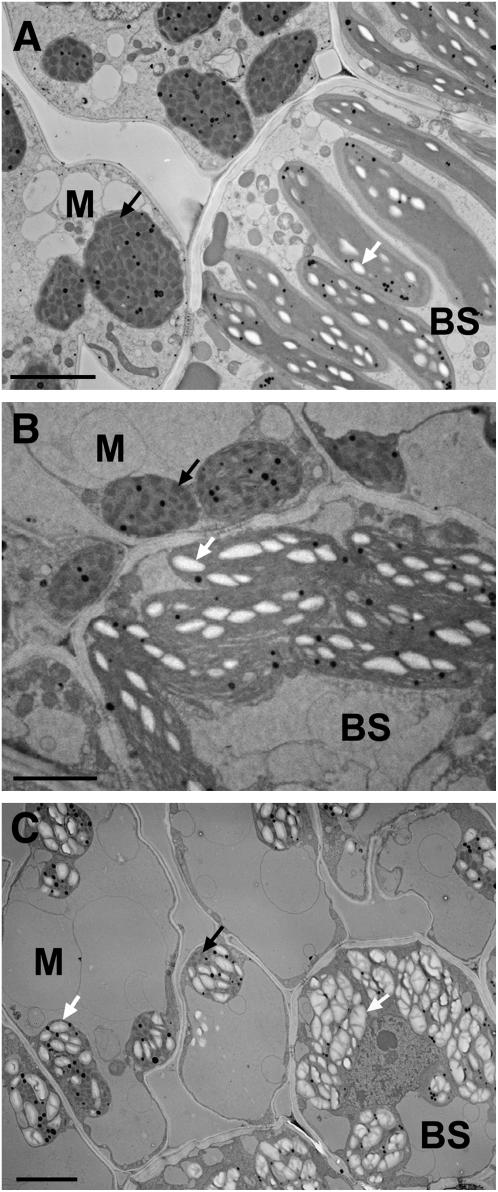
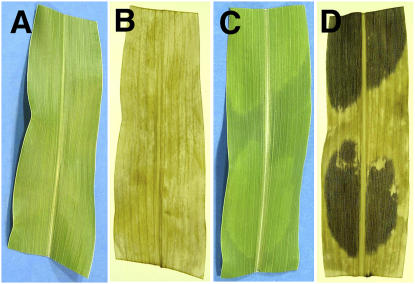
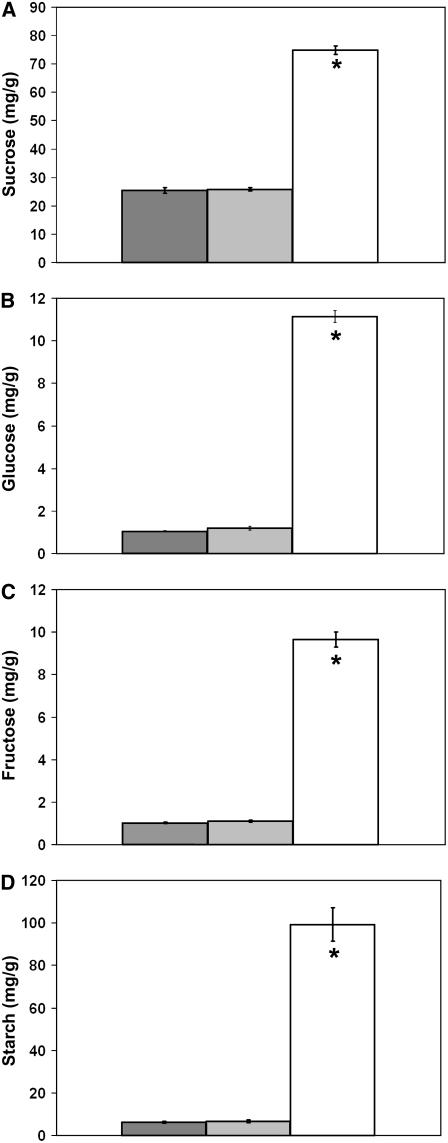
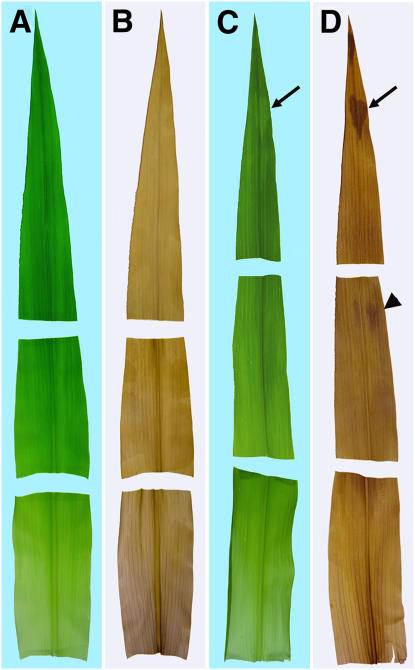
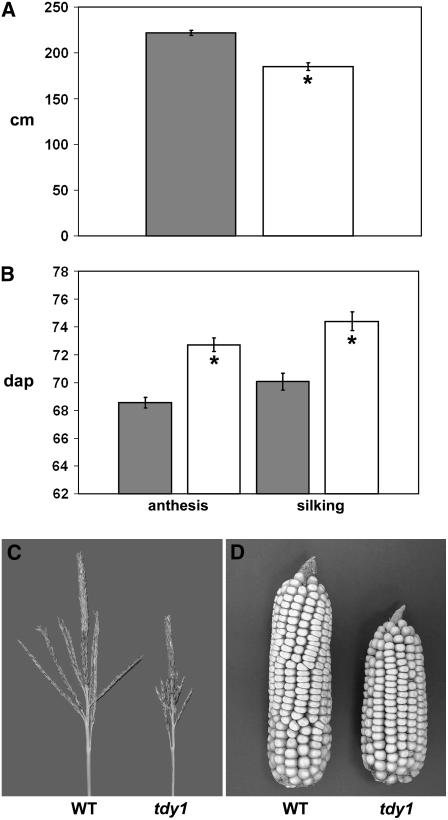
Acquisition of cell identity requires communication among neighboring cells. To dissect the genetic pathways regulating cell signaling in later leaf development, a screen was performed to identify mutants with chloroplast pigmentation sectors that violate cell lineage boundaries in maize (Zea mays) leaves. We have characterized a recessive mutant, tie-dyed1 (tdy1), which develops stable, nonclonal variegated yellow and green leaf sectors. Sector formation requires high light, occurs during a limited developmental time, and is restricted to leaf blade tissue. Yellow tdy1 sectors accumulate excessive soluble sugars and starch, whereas green sectors appear unaffected. Significantly, starch accumulation precedes chlorosis in cells that will become a yellow sector. Retention of carbohydrates in tdy1 leaves is associated with a delay in reproductive maturity, decreased stature, and reduced yield. To explain the tdy1 sectoring pattern, we propose a threshold model that incorporates the light requirement and the hyperaccumulation of photoassimilates. A possible function consistent with this model is that TDY1 acts as a sugar sensor to regulate an inducible sugar export pathway as leaves develop under high light conditions.
Figures
Similar articles
-
Tie-dyed1 and sucrose export defective1 act independently to promote carbohydrate export from maize leaves.Planta. 2008 Feb;227(3):527-38. doi: 10.1007/s00425-007-0636-6. Epub 2007 Oct 9. Planta. 2008. PMID: 17924136 Free PMC article.
-
Tie-dyed2 functions with tie-dyed1 to promote carbohydrate export from maize leaves.Plant Physiol. 2008 Mar;146(3):1085-97. doi: 10.1104/pp.107.111476. Epub 2008 Jan 24. Plant Physiol. 2008. PMID: 18218972 Free PMC article.
-
tie-dyed1 Functions non-cell autonomously to control carbohydrate accumulation in maize leaves.Plant Physiol. 2007 Jun;144(2):867-78. doi: 10.1104/pp.107.098814. Epub 2007 Apr 13. Plant Physiol. 2007. PMID: 17434986 Free PMC article.
-
The psychedelic genes of maize redundantly promote carbohydrate export from leaves.Genetics. 2010 May;185(1):221-32. doi: 10.1534/genetics.109.113357. Epub 2010 Feb 8. Genetics. 2010. PMID: 20142436 Free PMC article.
-
Determining the role of Tie-dyed1 in starch metabolism: epistasis analysis with a maize ADP-glucose pyrophosphorylase mutant lacking leaf starch.J Hered. 2008 Nov-Dec;99(6):661-6. doi: 10.1093/jhered/esn062. Epub 2008 Aug 22. J Hered. 2008. PMID: 18723774
Cited by
-
Genetic regulation of cold-induced albinism in the maize inbred line A661.J Exp Bot. 2013 Sep;64(12):3657-67. doi: 10.1093/jxb/ert189. Epub 2013 Jul 23. J Exp Bot. 2013. PMID: 23881393 Free PMC article.
-
Increased expression of a phloem membrane protein encoded by NHL26 alters phloem export and sugar partitioning in Arabidopsis.Plant Cell. 2013 May;25(5):1689-708. doi: 10.1105/tpc.113.111849. Epub 2013 May 28. Plant Cell. 2013. PMID: 23715470 Free PMC article.
-
Sucrose transporter1 functions in phloem loading in maize leaves.J Exp Bot. 2009;60(3):881-92. doi: 10.1093/jxb/ern335. Epub 2009 Jan 30. J Exp Bot. 2009. PMID: 19181865 Free PMC article.
-
Genetic control of carbon partitioning in grasses: roles of sucrose transporters and tie-dyed loci in phloem loading.Plant Physiol. 2009 Jan;149(1):71-81. doi: 10.1104/pp.108.129049. Plant Physiol. 2009. PMID: 19126697 Free PMC article. Review. No abstract available.
-
The Dominant and Poorly Penetrant Phenotypes of Maize Unstable factor for orange1 Are Caused by DNA Methylation Changes at a Linked Transposon.Plant Cell. 2018 Dec;30(12):3006-3023. doi: 10.1105/tpc.18.00546. Epub 2018 Dec 18. Plant Cell. 2018. PMID: 30563848 Free PMC article.
References
-
- Beckett JB (1994) Locating recessive genes to chromosome arm with B-A translocations. In M Freeling, V Walbot, eds, The Maize Handbook. Springer-Verlag, New York, pp 315–327
-
- Chalker-Scott L (1999) Environmental significance of anthocyanins in plant stress responses. Photochem Photobiol 70: 1–9
Publication types
MeSH terms
Substances
LinkOut - more resources
Full Text Sources
Miscellaneous
