. 2006 Dec;142(4):1380-96.
doi: 10.1104/pp.106.088534. Epub 2006 Oct 27.

Integrated analysis of metabolite and transcript levels reveals the metabolic shifts that underlie tomato fruit development and highlight regulatory aspects of metabolic network behavior

Affiliations

Integrated analysis of metabolite and transcript levels reveals the metabolic shifts that underlie tomato fruit development and highlight regulatory aspects of metabolic network behavior

Fernando Carrari et al. Plant Physiol. 2006 Dec.

Abstract

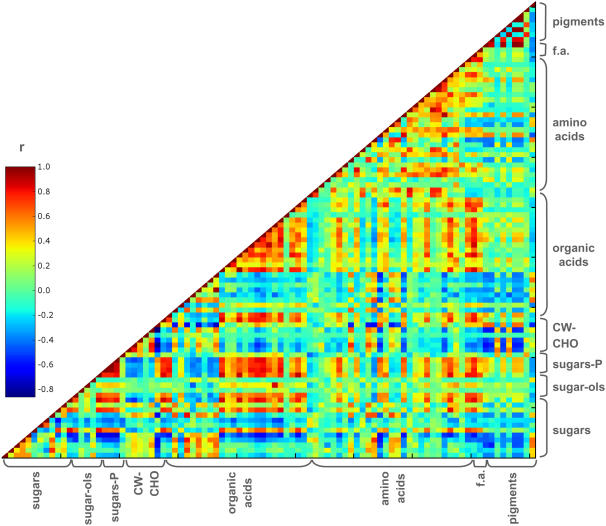
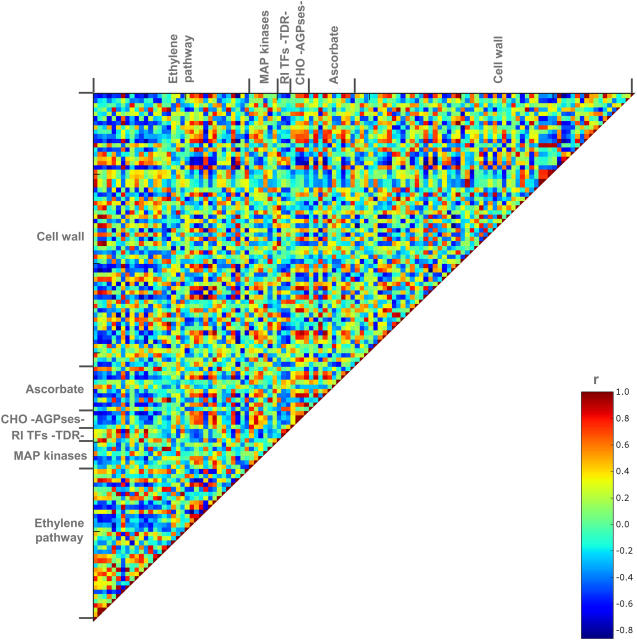
Tomato (Solanum lycopersicum) is a well-studied model of fleshy fruit development and ripening. Tomato fruit development is well understood from a hormonal-regulatory perspective, and developmental changes in pigment and cell wall metabolism are also well characterized. However, more general aspects of metabolic change during fruit development have not been studied despite the importance of metabolism in the context of final composition of the ripe fruit. In this study, we quantified the abundance of a broad range of metabolites by gas chromatography-mass spectrometry, analyzed a number of the principal metabolic fluxes, and in parallel analyzed transcriptomic changes during tomato fruit development. Metabolic profiling revealed pronounced shifts in the abundance of metabolites of both primary and secondary metabolism during development. The metabolite changes were reflected in the flux analysis that revealed a general decrease in metabolic activity during ripening. However, there were several distinct patterns of metabolite profile, and statistical analysis demonstrated that metabolites in the same (or closely related) pathways changed in abundance in a coordinated manner, indicating a tight regulation of metabolic activity. The metabolite data alone allowed investigations of likely routes through the metabolic network, and, as an example, we analyze the operational feasibility of different pathways of ascorbate synthesis. When combined with the transcriptomic data, several aspects of the regulation of metabolism during fruit ripening were revealed. First, it was apparent that transcript abundance was less strictly coordinated by functional group than metabolite abundance, suggesting that posttranslational mechanisms dominate metabolic regulation. Nevertheless, there were some correlations between specific transcripts and metabolites, and several novel associations were identified that could provide potential targets for manipulation of fruit compositional traits. Finally, there was a strong relationship between ripening-associated transcripts and specific metabolite groups, such as TCA-cycle organic acids and sugar phosphates, underlining the importance of the respective metabolic pathways during fruit development.


Figures

Figure 1.
Figure 1.
Experimental design. Tomato flowers, from plants growing under greenhouse conditions, were labeled daily and the fruits harvested at the indicated time point post anthesis. Six fruits from the second or third floors were collected per time point. FW and fruit diameter were measured in these fruits, and values presented correspond to means ± se from six determinations. Levels of chlorophylls a and b, β-carotene, lutein, neoxanthin, antheraxanthin, violaxanthin, lycopene, and zeaxanthin were measured in acetone extracts from 100 to 150 mg of frozen pericarp tissue as described by Thayer and Björkman (1990). Pigment contents are presented as percentages of the total measured. White triangles and black squares denote two different harvests. Arrowheads above the plot indicate fruit stages used for metabolic profile (gray) and transcript profile (black) analyses.
Figure 2.
Figure 2.
Metabolic profiles of tomato fruit along development. Relative metabolite contents of fruits harvested from 7 DAA until postripening (70 DAA). Metabolite contents were identified and quantified by GC-MS, and their relative amounts were calculated as described by Roessner-Tunali et al. (2003) relative to 7 DAA. Histograms show the relative amounts of soluble sugars (A), sugar alcohols (B), sugar phosphates (C), fatty acids (D), organic acids (E), TCA-cycle intermediates (F), amino acids (G), and cell wall components (H).
Figure 3.
Figure 3.
Visualization of metabolite-metabolite correlations. Heatmap of metabolite-metabolite correlations along developmental period of tomato fruits (from 7–70 DAA). Metabolites were grouped by compound class, and each square represents the correlation between the metabolite heading the column with the metabolite heading the row. Correlation coefficients and significances (two tailed) were calculated by applying Spearman algorithm using SSPS software. Out of 4,232 pairs analyzed, 2,430 resulted in significant correlations (P ≤ 0.05). Each square indicates a given r value resulting from a Spearman correlation analysis in a false color scale. The Web version of this figure allows mouse-over annotation that facilitates point-by-point evaluation of the data to facilitate its detailed interrogation.
Figure 4.
Figure 4.
Differences in transcript levels during tomato fruit development for genes associated with the photosynthetic light reactions, the TCA cycle, glycolysis, amino acid synthesis and degradation, and starch synthesis and degradation. All material was harvested in the middle of the day. Red and blue represent a decrease and an increase, respectively, of expression with respect to the average of all time points. Here each unigene that has been assigned to a process is represented by a single colored box. The color scale that was used is reproduced in the figure. This data are best viewed and all data point annotations provided at http://gabi.rzpd.de/projects/MapMan (see “Materials and Methods”). This Web site also gives simple instructions to facilitate its ease of use.
Figure 5.
Figure 5.
Heatmap of correlations between selected transcripts on the basis of involvement of processes previously described to be important in fruit development. Transcripts were grouped by functionality on the basis of MapMan gene ontology. In analogy to Figure 3, each square represents the correlation between the transcript heading the column with the transcript heading the row. Correlation coefficients and significances (two tailed) were calculated by applying Spearman algorithm using SSPS software. Each dot indicates a given r value resulting from a Spearman correlation analysis in a false color scale. RI TFs TDR, Ripening-related transcription factors (TDR family). CHO-AGPses, Carbohydrate metabolism-ADP-Glc pyrophosphorylases. The Web version of this figure allows mouse-over annotation that facilitates point-by-point evaluation of the data to facilitate its detailed interrogation.
Figure 6.
Figure 6.
Selected transcript-metabolite correlation visualizations. Heatmap surface of selected transcript-metabolite correlations was drawn and correlation coefficients were calculated as described for Figures 3 and 5. Each dot indicates a given r value resulted from a Spearman correlation analysis in a false color scale. RI TFs TDR, Ripening-related transcription factors (TDR family). CHO-AGPses, Carbohydrate metabolism-ADP-Glc pyrophosphorylases. The Web version of this figure allows mouse-over annotation that facilitates point-by-point evaluation of the data to facilitate its detailed interrogation.

References

    1. Adams-Phillips L, Barry C, Giovannoni J (2004) Signal transduction systems regulating fruit development. Trends Plant Sci 9: 331–338 - PubMed
    1. Agius F, Gonzalez-Lemothe R, Caballero JL, Munoz-Blanco J, Botella MA, Valpuesta V (2003) Engineering increased vitamin C levels in plants by overexpression of a D-galacturonic acid reductase. Nat Biotechnol 21: 177–181 - PubMed
    1. Alba R, Fei ZJ, Payton P, Liu Y, Moore SL, Debbie P, Cohn J, D'Ascenzo M, Gordon JS, Rose JK, et al (2004) ESTs, cDNA microarrays, and gene expression profiling: tools for dissecting plant physiology and development. Plant J 39: 697–714 - PubMed
    1. Alba R, Payton P, Fei Z, McQuinn R, Debbie P, Martin G, Tanksley SD, Giovannoni JJ (2005) Transcriptome and selected metabolite analysis reveal multiple points of ethylene regulatory control during tomato fruit development. Plant Cell 17: 2954–2965 - PMC - PubMed
    1. Albersheim P, Nevins DJ, English PD, Karr A (1967) A method for the analysis of sugars in plant cell wall polysaccharides by gas-liquid chromatography. Carbohydr Res 5: 340–345

Publication types

MeSH terms

LinkOut - more resources