. 2007 Jan 15;92(2):578-87.
doi: 10.1529/biophysj.106.093666. Epub 2006 Oct 27.

Dissecting the pretransitional conformational changes in aminoacylase I thermal denaturation

Affiliations

Dissecting the pretransitional conformational changes in aminoacylase I thermal denaturation

Jing-Tan Su et al. Biophys J. .

Abstract

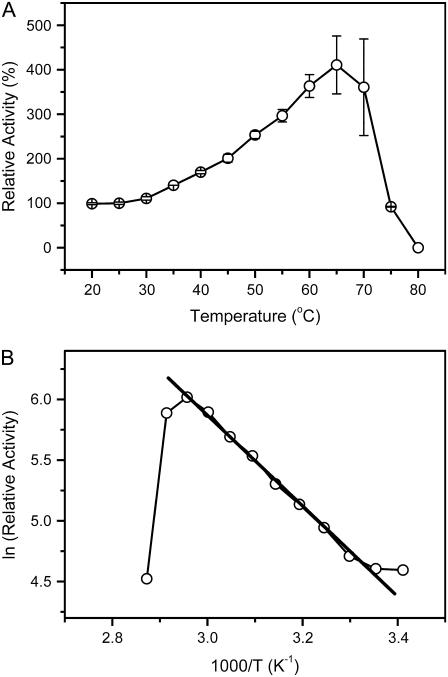
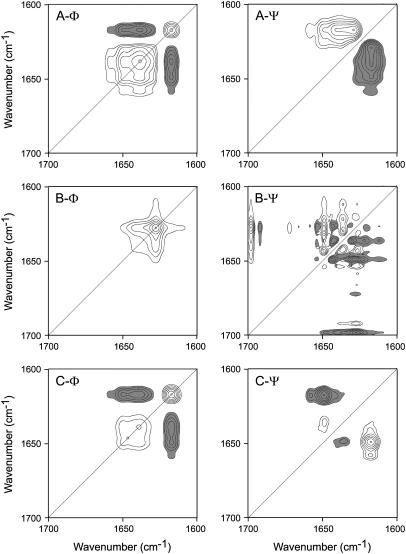
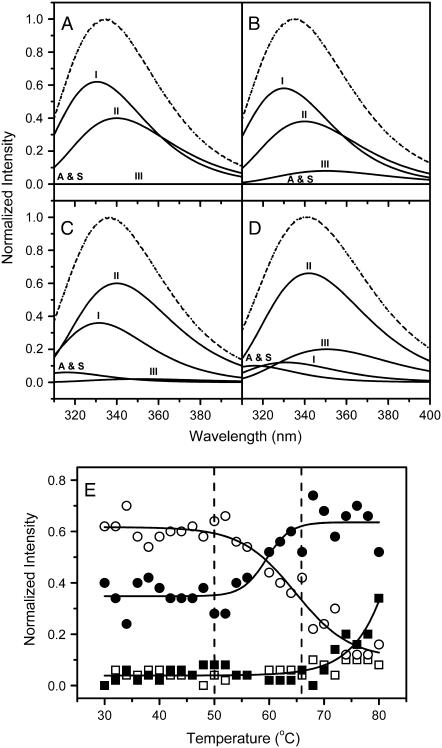
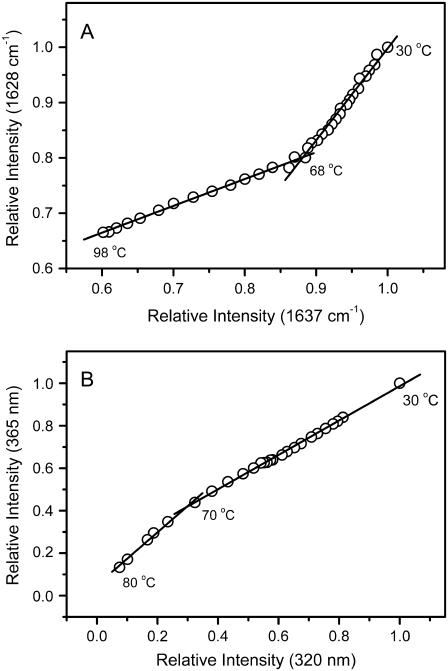
Aminoacylase I (ACYI) catalyzes the stereospecific hydrolysis of L-acylamino acids and is generally assumed to be involved in the final step of the degradation of intracellular N-acetylated proteins. Apart from its crucial functions in intracellular amino acid metabolism, ACYI also has substantial commercial importance for the optical resolution of N-acylated DL-amino acids. As a zinc-dependent enzyme, ACYI is quite stable against heat-induced denaturation and can be regarded as a thermostable enzyme with an optimal temperature for activity of approximately 65 degrees C. In this research, the sequential events in ACYI thermal denaturation were investigated by a combination of spectroscopic methods and related resolution-enhancing techniques. Interestingly, the results from fluorescence and infrared (IR) spectroscopy clearly indicated that a pretransitional stage existed at temperatures from 50 degrees C to 66 degrees C. The thermal unfolding of ACYI might be a three-state process involving an aggregation-prone intermediate appearing at approximately 68 degrees C. The pretransitional structural changes involved the partial unfolding of the solvent-exposed beta-sheet structures and the transformation of about half of the Class I Trp fluorophores to Class II. Our results also suggested that the usage of resolution-enhancing techniques could provide valuable information of the step-wise unfolding of proteins.


Figures

FIGURE 1
FIGURE 1
Thermal dependence of ACYI activity. The enzyme was dissolved in 30 mM Tris-HCl, pH 7.5, with a final concentration of 2 μM. The activity was measured by incubating the enzyme solutions at given temperatures for 30 min, and then the activity assay was performed by mixing the enzyme solutions and reaction buffers preheated at the same temperatures. (A) The data were normalized by taking the activity of the sample incubated at 25°C as 100%. (B) The Arrhenius plot for the ACYI activity in the temperature range 20°C–75°C. Activation energy calculated from the slope of the straight line (30–65°C) is 31 kJ mol−1.
FIGURE 2
FIGURE 2
Thermal dependence of the heat flow of ACYI thermal denaturation probed by DSC. The heating rates were 0.5 or 1.0 K/min, and the protein concentrations were 1.0 or 1.5 mg/ml. The dotted line represents the thermal transition examined by reheating the sample after cooling from the first scan (solid line). The positive peaks in the DSC profile are exothermic.
FIGURE 3
FIGURE 3
Thermal dependence of the original (A), FSD (B), and second derivative (C) IR spectra of ACYI. For clarity, only the typical spectra are presented. The arrows indicate the direction of intensity changes with the temperature increasing from 30°C to 40°C, 50°C, 60°C, 70°C, 80°C, 90°C, and 98°C, respectively. FSD was performed using the software Spectrum v3.02 with a γ-factor of 2.5 and a Bessel smoothing of 70%, and the second derivative was carried out using the algorithm in the software with a nine-point Savitzky-Golay smoothing. (A) The arrows indicate the bands at 1682, 1642, and 1618 cm−1, from left to right, respectively. (B) and (C) The arrows show the bands around 1682, 1660, 1651, 1645, 1637, 1630, and 1618 cm−1, from left to right, respectively.
FIGURE 4
FIGURE 4
The IR difference spectra (A) and the thermal melting curves (B) of ACYI. (A) The difference absorption spectra, shown at 4°C intervals, were obtained by subtracting the spectrum recorded at 30°C. The solid arrows indicate the directions of the intensity changes of bands (1682 and 1618 cm−1) from the cross-β structures in aggregates as the temperature increased. The dotted arrows show the directions of the intensity changes and positions of bands from the native structures upon heating. (B) The melting curves of the amide I′ bands were at 1674 (▪), 1651 (□), 1637 (○), 1630 (▵), and 1618 cm−1 (•), respectively. The data were calculated from the spectra in Fig. 3 C using the published procedures (28). The dashed line indicates the temperature at which aggregates were observed.
FIGURE 5
FIGURE 5
The 2D correlation analysis of the IR spectra of ACYI thermal denaturation. Synchronous (Φ) and asynchronous (Ψ) plots were constructed from the corresponding FSD spectra recorded in the temperature range of 30–98°C (A), 30–66°C (B), and 74–98°C (C). The spectra recorded at temperatures from 68°C to 72°C was not included in the 2D IR analysis in panel C to avoid possible artifacts caused by band shift accompanied with slight intensity changes (see also Fig. 4 A). The plots are presented as contour maps produced by drawing the contour lines every 10% off from the maximum intensity of the corresponding map. Clear and dark peaks represent positive and negative, respectively.
FIGURE 6
FIGURE 6
Thermal dependence of the intrinsic Trp fluorescence spectra (A) and the melting curves (B) of ACYI. The protein concentration was 1 mg/ml. The spectra were obtained with an excitation wavelength of 295 nm to avoid the contributions of the Tyr residues. The abnormal change of the parameters above 80°C was due to serious aggregation and was not used in further analysis. (A) The dotted arrows indicate the directions of the intensity changes and positions of the emission maximum wavelength of ACYI as the temperature increased. The spectrum recorded at 82°C is represented by a dotted line. (B) The intensity change of the intrinsic fluorescence at 330 nm (○) and the change of Parameter A (•) are shown. Parameter A, which is a sensitive tool to reflect the shape and position of the Trp fluorescence spectrum (31), was obtained by dividing the intensity at 320 nm by that at 365 nm.
FIGURE 7
FIGURE 7
Fitting of the experimental fluorescence spectra by the theoretical model of discrete states of Trp residues in proteins. (AD) The fitting results of the spectra recorded at 30°C (A), 48°C (B), 64°C (C), and 78°C (D). The fitted spectra (dashed lines) are the sum of the four spectral components (solid lines), Classes A and S, I, II, and III fluorophores. The experimental data are represented by dotted lines. (E) The thermal dependence of the maximum intensity of Classes A and S (□), I (○), II (•), and III fluorophores (▪). The dashed lines indicate the temperature range of the pretransitional stage.
FIGURE 8
FIGURE 8
Phase diagram analysis of the original IR (A) and intrinsic fluorescence (B) data. The phase diagram analysis was carried out as described previously (35). The FSD IR or fluorescence data were normalized by the corresponding intensity of the spectra recorded at 30°C. The phase diagram was constructed by the IR intensity at 1637 cm−1 vs. 1628 cm−1 (A) or the fluorescence intensity at 320 nm versus that at 365 nm (B). Each straight line in the phase diagram reflects a two-state process, and the joint position of two adjacent lines indicates that an intermediate appeared at the corresponding temperature.

References

    1. Anders, M. W., and W. Dekant. 1994. Aminoacylases. Adv. Pharmacol. 27:431–448. - PubMed
    1. Hernick, M., and C. A. Fierke. 2005. Zinc hydrolases: the mechanisms of zinc-dependent deacetylases. Arch. Biochem. Biophys. 433:71–84. - PubMed
    1. Seibert, C. M., and F. M. Raushel. 2005. Structural and catalytic diversity within the amidohydrolase superfamily. Biochemistry. 44:6383–6391. - PubMed
    1. Birnbaum, S. M. 1955. Aminoacylase, amino acid acylase I and II from hog kidney. Methods Enzymol. 2:115–119.
    1. Kordel, W., and F. Schneider. 1976. Chemical investigation on pig kidney aminoacylase. Biochim. Biophys. Acta. 445:446–457. - PubMed

Publication types