. 2007 Jan 15;92(2):654-60.
doi: 10.1529/biophysj.106.094524. Epub 2006 Oct 27.

Transient directed motions of GABA(A) receptors in growth cones detected by a speed correlation index

Affiliations

Transient directed motions of GABA(A) receptors in growth cones detected by a speed correlation index

Cédric Bouzigues et al. Biophys J. .

Abstract

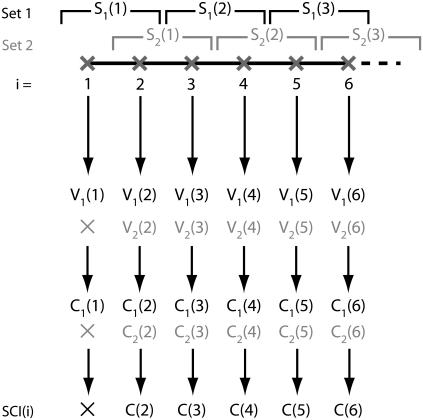
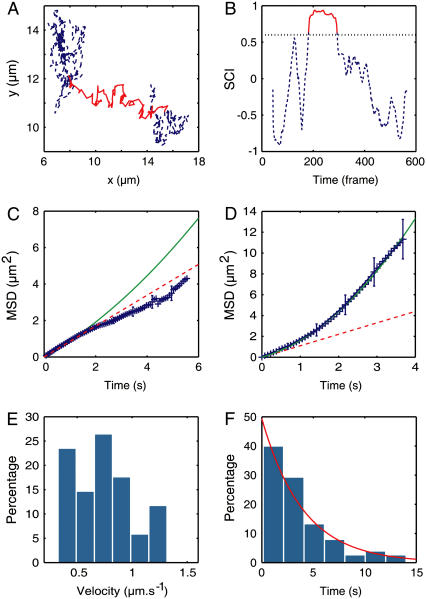
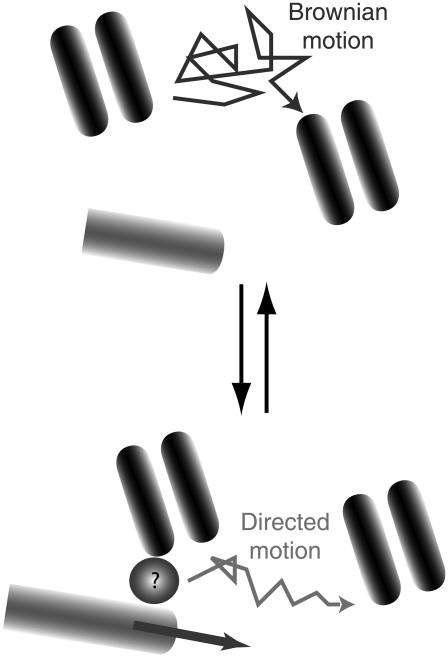
Single-molecule tracking of membrane proteins has become an important tool for investigating dynamic processes in live cells, such as cell signaling, membrane compartmentation or trafficking. The extraction of relevant parameters, such as interaction times between molecular partners or confinement-zone sizes, from the trajectories of single molecules requires appropriate statistical methods. Here we report a new tool, the speed correlation index, designed to detect transient periods of directed motion within trajectories of diffusing molecules. The ability to detect such events in a wide range of biologically relevant parameter values (speed, diffusion coefficient, and durations of the directed period) was first established on simulated data. The method was next applied to analyze the trajectories of quantum-dot-labeled GABA(A) receptors in nerve growth cones. The use of the speed correlation index revealed that the receptors had a "conveyor belt" type of motion due to temporary interactions ( approximately 4.0 s) between the receptors and the microtubules, leading to an average directed motion (velocity approximately 0.3 mum s(-1)) in the growth-cone membrane. Our observations point to the possibility of a cytoskeleton-dependent redistribution of the sensing molecules in the membrane, which could play a role in the modulation of the cell response to external signals.


Figures

FIGURE 1
FIGURE 1
Principle of the algorithm in the case L = 2. Two sets of segments are defined (S1 and S2), providing two sets of speeds and correlations, V1 and V2, and C1 and C2, respectively (C2 is not defined for the frame i = 1). The averaging of correlations yields the value C of the speed correlation index.
FIGURE 2
FIGURE 2
(A) Example of simulated trajectories with a period of directed motion (upper) with velocity v = 0.8 μm s−1 (solid line, between 8.7 s and 15.6 s) and purely Brownian (lower). (B) SCI for the directed trajectory (solid line) and two Brownian trajectories (dash-dotted line). The thresholding procedure enables the detection of the directed period (between 8.0 s and 15.9 s). Due to random fluctuations, high values of the SCI can be reached in Brownian trajectories for short durations. (C) Threshold determination. A part of the SCI curve above the height H for a continuous time T is indicative of a directed motion if the point of coordinates (H,T) is in the gray region on the graph.
FIGURE 3
FIGURE 3
(A) Distribution of detected drift times in simulated trajectories (bins) and the resulting exponential fit with Tm = 4.5 s (solid curve), compared to the exponential distribution with T = 4.1 s (dashed curve) used as input in the simulation. (B and C) Percentage of detection as a function of (B) the velocity v for T = 2.25 s (+), 3 s (⋄), 4.1 s (□) and 8 s (X), and (C) the average duration T for v = 0.2 μm s−1 (*), 0.4 μm s−1 (□), 0.8 μm s−1 (⋄) and 1.5 μm s−1 (+). In all the trajectories, D was equal to 0.25 μm2 s−1. (D) Average duration Tm of the directed periods as a function of the duration T used in the simulation.
FIGURE 4
FIGURE 4
(A) Trajectory of a single GABAAR in the GC membrane. (B) MSD computed between 0 and Ttot/5 with a quadratic fit 4Dt + v2t2 (D = 0.30 μm2 s−1, v = 0.35 μm s−1). (C) Proportion of directed trajectories in the control case and after drug treatment. (D and E) Distribution of diffusion coefficients and velocity of GABAARs in the control case. (F) Distribution of velocity after microtubule depolymerization by nocodazole and 2-h recovery in free medium.
FIGURE 5
FIGURE 5
(A) Example of an experimental trajectory. (B) Corresponding SCI. In both graphs, the detected period of directed motion is indicated by the red continuous line. (C) Average MSD during the periods identified by the SCI as Brownian with a linear fit 4Dt, D = 0.21 μm2 s−1 (dashed line). (D) Average MSD during the periods identified as directed with a quadratic fit 4Dt + v2t2, D = 0.26 μm2 s−1 and v = 0.76 μm2 s−1 (solid line). (E) Distribution of velocity in the directed periods. (D) Distribution of the duration of directed periods adjusted with an exponential curve exp(−t/τ) with τ = 4.0 s.
FIGURE 6
FIGURE 6
Conveyor-belt motion of GABAARs in the GC membrane. Receptors switch between free diffusion and MT-dependent directed movement. As a result of this dynamic equilibrium, individual GABAARs are displaced with an average velocity of ∼0.3 μm s−1. The molecular intermediate (circle with a question mark) between receptors and microtubules is not known.

References

    1. Dietrich, C., B. Yang, T. Fujiwara, A. Kusumi, and K. Jacobson. 2002. Relationship of lipid rafts to transient confinement zones detected by single particle tracking. Biophys. J. 82:274–284. - PMC - PubMed
    1. Simson, R., B. Yang, S. E. Moore, P. Doherty, F. S. Walsh, and K. A. Jacobson. 1998. Structural mosaicism on the submicron scale in the plasma membrane. Biophys. J. 74:297–308. - PMC - PubMed
    1. Lommerse, P. H., G. A. Blab, L. Cognet, G. S. Harms, B. E. Snaar-Jagalska, H. P. Spaink, and T. Schmidt. 2004. Single-molecule imaging of the H-ras membrane-anchor reveals domains in the cytoplasmic leaflet of the cell membrane. Biophys. J. 86:609–616. - PMC - PubMed
    1. Daumas, F., N. Destainville, C. Millot, A. Lopez, D. Dean, and L. Salome. 2003. Confined diffusion without fences of a G-protein-coupled receptor as revealed by single particle tracking. Biophys. J. 84:356–366. - PMC - PubMed
    1. Ueda, M., Y. Sako, T. Tanaka, P. Devreotes, and T. Yanagida. 2001. Single-molecule analysis of chemotactic signaling in Dictyostelium cells. Science. 294:864–867. - PubMed

Publication types

Substances

LinkOut - more resources