. 2007 Mar;292(3):H1352-63.
doi: 10.1152/ajpheart.00065.2006. Epub 2006 Oct 27.

Vasopressin stimulates action potential firing by protein kinase C-dependent inhibition of KCNQ5 in A7r5 rat aortic smooth muscle cells

Affiliations

Vasopressin stimulates action potential firing by protein kinase C-dependent inhibition of KCNQ5 in A7r5 rat aortic smooth muscle cells

Lioubov I Brueggemann et al. Am J Physiol Heart Circ Physiol. 2007 Mar.

Abstract

[Arg(8)]-vasopressin (AVP), at low concentrations (10-500 pM), stimulates oscillations in intracellular Ca(2+) concentration (Ca(2+) spikes) in A7r5 rat aortic smooth muscle cells. Our previous studies provided biochemical evidence that protein kinase C (PKC) activation and phosphorylation of voltage-sensitive K(+) (K(v)) channels are crucial steps in this process. In the present study, K(v) currents (I(Kv)) and membrane potential were measured using patch clamp techniques. Treatment of A7r5 cells with 100 pM AVP resulted in significant inhibition of I(Kv). This effect was associated with gradual membrane depolarization, increased membrane resistance, and action potential (AP) generation in the same cells. The AVP-sensitive I(Kv) was resistant to 4-aminopyridine, iberiotoxin, and glibenclamide but was fully inhibited by the selective KCNQ channel blockers linopirdine (10 microM) and XE-991 (10 microM) and enhanced by the KCNQ channel activator flupirtine (10 microM). BaCl(2) (100 microM) or linopirdine (5 microM) mimicked the effects of AVP on K(+) currents, AP generation, and Ca(2+) spiking. Expression of KCNQ5 was detected by RT-PCR in A7r5 cells and freshly isolated rat aortic smooth muscle. RNA interference directed toward KCNQ5 reduced KCNQ5 protein expression and resulted in a significant decrease in I(Kv) in A7r5 cells. I(Kv) was also inhibited in response to the PKC activator 4beta-phorbol 12-myristate 13-acetate (10 nM), and the inhibition of I(Kv) by AVP was prevented by the PKC inhibitor calphostin C (250 nM). These results suggest that the stimulation of Ca(2+) spiking by physiological concentrations of AVP involves PKC-dependent inhibition of KCNQ5 channels and increased AP firing in A7r5 cells.


Figures

Fig. 1
Fig. 1
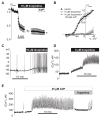
Inhibition of K+ currents in a single A7r5 cell by AVP triggers action potential (AP) generation. A and B: original current traces recorded in a single A7r5 cell before (A) and after (B) application of 100 pM AVP for 10 min. Step voltage protocol is shown in A. C: sustained outward currents were evaluated by averaging 1,000 points collected over the last 100 ms of the voltage pulse, and L-type Ca2+ currents were evaluated by measuring the peak inward current. Mean current recorded at the end of the pulse (circles) and peak current recorded at the beginning of the pulse (triangles) in control (filled symbols) and after application of 100 pM AVP (open symbols) are shown (n = 5). I, current; V, voltage. *P < 0.05, statistically significant differences from control (Student’s t-test). D: APs stimulated by 100 pM AVP, recorded in the same cell in current-clamp mode. Similar results were obtained in 6 experiments.
Fig. 2
Fig. 2
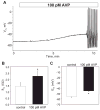
Membrane depolarization by AVP is associated with an increase in membrane resistance (Rm). A: representative trace shows time course of AP activation in a single A7r5 cell treated with 100 pM AVP. Note membrane depolarization prior to AP generation. Similar results were obtained in 6 experiments; mean time to initiation of AP firing was 5.7 ± 0.8 min (n = 6). Vm, membrane potential. B: application of 100 pM AVP significantly increased Rm from 1.44 ± 0.27 to 2.26 ± 0.41 GΩ (n = 7, P = 0.005, paired t-test) as calculated from the currents measured in response to 20-mV voltage steps from −64 to −44 mV (±10 mV from the resting membrane potential, Em). C: in the same time frame, application of 100 pM AVP significantly depolarized the membrane from −55.9 ± 1.6 to −45.2 ± 1.4 mV (n = 8, P < 0.001).
Fig. 3
Fig. 3
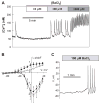
K+ channel blocker BaCl2 mimics AVP in inhibition of Kv currents, stimulation of AP firing, and Ca2+ spiking. A: Ca2+ spiking activity (intracellular Ca2+ concentration, [Ca2+]i) in a population of A7r5 cells in response to BaCl2, a nonselective K+ channel blocker (representative of 5 similar experiments). Similar to AVP, 100 μM BaCl2 inhibits outward K+ current and activates AP firing. B: mean current recorded at the end of the pulse (circles) and peak current recorded at the beginning of the pulse (triangles) in control (filled symbols) and in the presence of 100 μM BaCl2 (open symbols). Data are presented as means ± SE, n = 5. *P < 0.05, statistically significant differences from the control (paired Student’s t-test). C: representative trace of Vm recorded in current-clamp mode showing stimulation of AP generation by 100 μM BaCl2 in a single A7r5 cell.
Fig. 4
Fig. 4
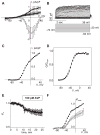
Isolation of AVP-sensitive Kv currents in single A7r5 cells. A: mean current recorded at the end of the pulse (●) and peak inward current recorded at the beginning of the pulse in control (○) followed by application of 10 μM verapamil plus 100 nM iberiotoxin for 10 min (▴). Verapamil and iberiotoxin were then replaced with 100 μM GdCl3 (▪) for an additional 10 min (n = 4). Peak inward currents recorded in the presence of verapamil plus iberiotoxin and GdCl3 were omitted for clarity. B: representative traces of current recorded in the presence of 100 μM GdCl3 in external solution to isolate Kv component (top). With a holding potential of −74 mV, a voltage step protocol was applied to test potentials from −94 to +36 mV, followed by steps to −30 mV for tail-current recording. Dotted line indicates 0 current level. C: mean current recorded at the end of the pulse (1,000 points recorded over the last 500 ms were averaged) from the traces presented in B after leak subtraction and normalization to the cell capacitance (C = 284 pF). D: voltage dependence of steady-state activation fitted by the single Boltzmann function (solid line, see Materials and Methods). Conductance was calculated from the tail currents measured at −30 mV based on a K+ reversal potential of −84 mV. Voltage of half-maximal activation (V0.5) = −38.0 ± 1.6 mV; slope factor (s) −8.3 ± 0.4 mV (n = 21); G/Gmax, fractional maximal conductance. E: time course of Kv current inhibition by 100 pM AVP recorded by applying a 5-s step to a membrane potential of 0 mV from a holding potential of −74 mV at 15-s intervals. Currents were normalized to mean control current (I/Ic) recorded for 10 min before adding AVP (n = 7). F: I-V curves of mean outward current measured in the presence of 100 μM Gd3+ in control and after exposure to 100 pM AVP for 15 min. After leak subtraction, currents were normalized to the maximal control current (I/Imax; ●) measured at −36 mV. AVP significantly reduced Kv current at all membrane potentials from −54 to +36 mV (n = 7, P < 0.05, paired Student’s t-test).
Fig. 5
Fig. 5
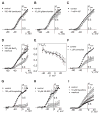
Pharmacology of Kv current. I-V curves of mean outward current were measured as described in Fig. 4 legend in the presence of 100 μM Gd3+. After leak subtraction, currents were normalized to the maximal control current measured at 36 mV. Currents were measured in the presence of 100 nM iberiotoxin (A; n = 4), 10 μM glibenclamide (B; n = 3), 1 mM 4-aminopyridine (4-AP; C; n = 3), 100 μM BaCl2 followed by washout (D; n = 5), 1 μM correolide (F; n = 4), 100 μM linopirdine (G; n = 3), 10 μM XE-991 (H; n = 3), and 10 μM flupirtine followed by washout (I; n = 4). *P < 0.05, statistically significant difference from control (paired Student’s t-test). E: inhibition of Kv current by Ba 2+ was voltage dependent. Currents recorded in the presence of 100 μM Ba2+(IBa) were reduced compared with control current (Ic) by 75 ± 9% at −44 mV and by 32 ± 11% at +36 mV. *P < 0.05, statistically significant difference from inhibition at −44 mV [1-way repeated-measures ANOVA (Holm-Sidak method)]. Data are presented as means ± SE.
Fig. 6
Fig. 6
Effects of KCNQ channel blockers/activators on A7r5 cell excitability. A: mean time course for inhibition of IKv by 10 μM linopirdine was measured as described for 100 pM AVP in Fig. 4E (n = 3). AVP (100 pM) was added to the bath after 15-min treatment with linopirdine. B: I-V curves (after leak subtraction; mean of 3) recorded before, during 10 μM linopirdine treatment, and after 5-min exposure to 100 pM AVP in the continued presence of linopirdine (time points indicated by a, b, and c, respectively, in A). C: representative trace of membrane potential recorded in current-clamp mode showing stimulation of AP generation by 10 μM linopirdine in a single A7r5 cell. D: stimulation of Ca2+ spiking activity by 5 μM linopirdine in a population of A7r5 cells (representative of 4 similar experiments with concentrations of linopirdine between 1 and 10 μM). E: AVP-induced Ca2+ spiking activity was transiently reversed by application of 10 μM flupirtine (representative of 3 similar experiments).
Fig. 7
Fig. 7
Expression of KCNQ isoforms in A7r5 cells and adult rat aorta. Total RNA prepared from A7r5 cells (A7), adult rat thoracic aorta (Ao), or adult rat brain as a positive control (+) was reverse transcribed and subjected to PCR using primers specific for KCNQ1 through KCNQ5. Molecular weight marker (M) is a 100-bp ladder; 500 bp is indicated at left. Expected sizes of reaction products are KCNQ1, 453 bp; KCNQ2, 372 bp; KCNQ3, 424 bp; KCNQ4, 495 bp; and KCNQ5, 240 bp. Products were confirmed by DNA sequencing.
Fig. 8
Fig. 8
KCNQ5 short hairpin (sh)RNA reduces KCNQ5 expression and Kv currents in A7r5 cells. A: KCNQ5 protein expression in A7r5 cells infected with lentiviral vectors for expression of KCNQ5 shRNA (lv-GFP_KCNQ5-shRNA) was detected by immunohistochemical analysis using rabbit polyclonal anti-KCNQ5 antibodies and an Alexa Fluor 594-conjugated goat anti-rabbit IgG secondary antibody (i). Green fluorescent protein (GFP) was used as an indication of expression of the KCNQ5 shRNA construct (ii; GFP-expressing cell outlined in yellow in both images; control cell without GFP fluorescence outlined in cyan in both images). Cells expressing GFP displayed reduced KCNQ5 immunoreactivity. B: quantitative image analysis of 128 cells, comparing KCNQ5 immunoreactivity in cells expressing KCNQ5 shRNA or non-GFP-expressing control cells in the same cultures. *P < 0.05, significant difference from control (Student’s t-test). C: I-V curves of mean outward current (measured as described in Fig. 4 legend in the presence of 100 μM Gd3+) after leak subtraction and normalization to the cell capacitance. KV currents were measured in GFP-fluorescent A7r5 cells from parallel cultures infected with lv-GFP_KCNQ5-shRNA (n = 6) or GFP alone (n = 5). In the voltage range from −44 to −1 mV, Kv currents were significantly reduced (by ~50%) in lv-KCNQ5_shRNA-infected cells (P < 0.05, unpaired Student’s t-test).
Fig. 9
Fig. 9
PKC dependence of Kv currents. A: I-V curves of mean currents recorded at the end of voltage pulses in control and after application of 10 nM PMA for 10 min. After leak subtraction, currents were normalized to the maximal control current measured at −36 mV, and data are presented as means ± SE (n = 3). B: I-V curves of mean currents recorded at the end of voltage pulses before (control) and after AVP application for 10 min. Currents were normalized to the maximal control current measured at 36 mV, and data are presented as means ± SE (n = 3). C: a similar series of experiments was conducted in cells pretreated for 1 h with 250 nM calphostin C. Results are displayed as described in B (n = 3). All measurements for A–C were made in the presence of 100 μM GdCl3 in the external solution.

Similar articles

Cited by

References

    1. Beisel KW, Rocha-Sanchez SM, Morris KA, Nie L, Feng F, Kachar B, Yamoah EN, Fritzsch B. Differential expression of KCNQ4 in inner hair cells and sensory neurons is the basis of progressive high-frequency hearing loss. J Neurosci. 2005;25:9285–93. - PMC - PubMed
    1. Betts LC, Kozlowski RZ. Electrophysiological effects of endothelin-1 and their relationship to contraction in rat renal arterial smooth muscle. Br J Pharmacol. 2000;130:787–796. - PMC - PubMed
    1. Byron KL, Lucchesi PA. Signal transduction of physiological concentrations of vasopressin in A7r5 vascular smooth muscle cells. J Biol Chem. 2002;277:7298–7307. - PubMed
    1. Byron KL, Villereal ML. Mitogen-induced [Ca2+]i changes in individual human fibroblasts. Image analysis reveals asynchronous responses which are characteristic for different mitogens. J Biol Chem. 1989;264:18234–18239. - PubMed
    1. Byron KL. Vasopressin stimulates Ca2+ spiking activity in A7r5 vascular smooth muscle cells via activation of phospholipase A2. Circ Res. 1996;78:813–820. - PubMed

Publication types

LinkOut - more resources