

Poor glycated haemoglobin control and adverse pregnancy outcomes in type 1 and type 2 diabetes mellitus: systematic review of observational studies
- PMID: 17074087
- PMCID: PMC1635059
- DOI: 10.1186/1471-2393-6-30
Poor glycated haemoglobin control and adverse pregnancy outcomes in type 1 and type 2 diabetes mellitus: systematic review of observational studies
Abstract
Background: Glycaemic control in women with diabetes is critical to satisfactory pregnancy outcome. A systematic review of two randomised trials concluded that there was no clear evidence of benefit from very tight versus tight glycaemic control for pregnant women with diabetes.
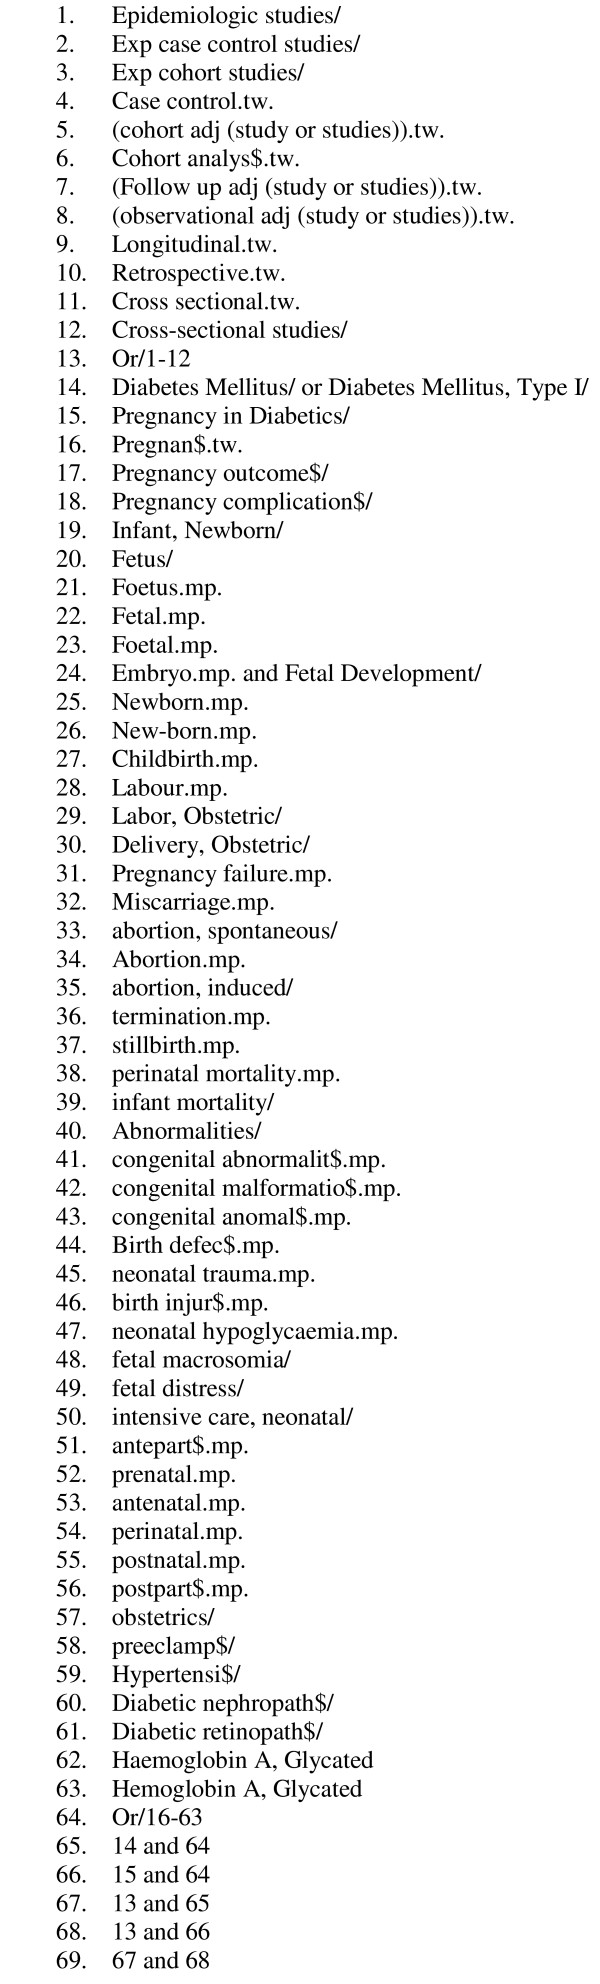
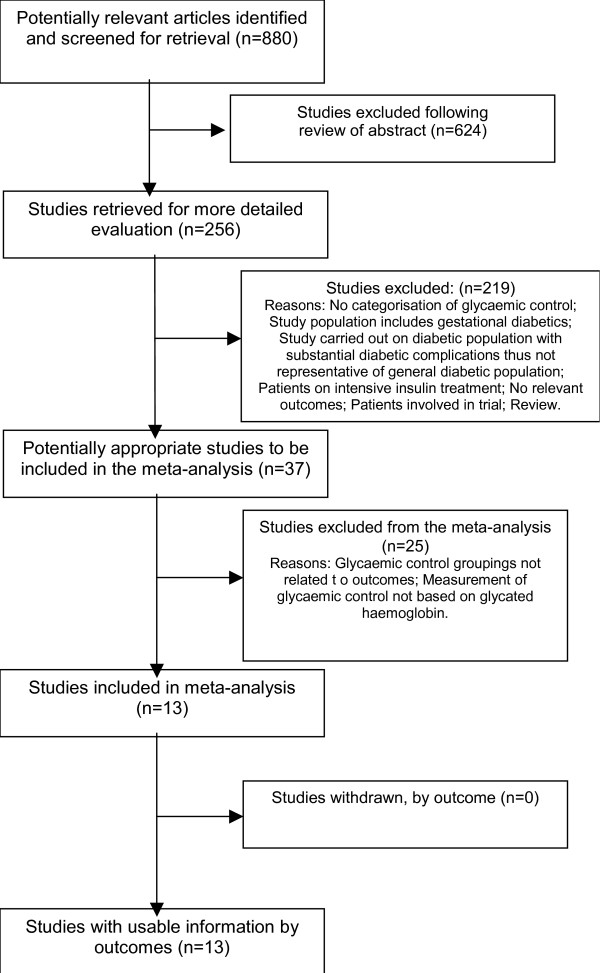
Methods: A systematic review of observational studies addressing miscarriage, congenital malformations and perinatal mortality among pregnant women with type 1 and type 2 diabetes was carried out. Literature searches were performed in MEDLINE, EMBASE, CINAHL and Cochrane Library. Observational studies with data on glycated haemoglobin (HbA1c) levels categorised into poor and optimal control (as defined by the study investigators) were selected. Relative risks and odds ratios were calculated for HbA1c and pregnancy outcomes. Adjusted relative risk estimates per 1-percent decrease in HbA1c were calculated for studies which contained information on mean and standard deviations of HbA1c.
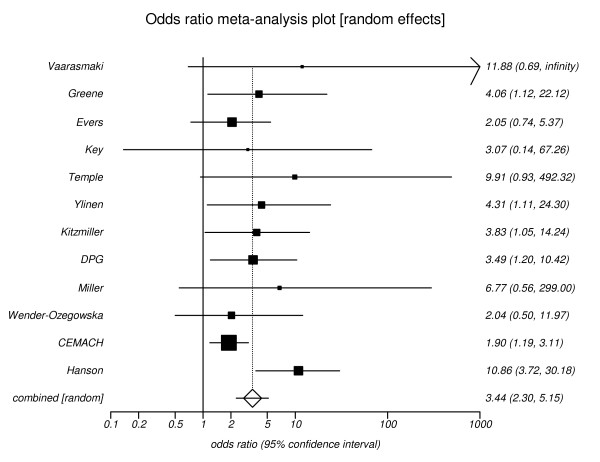
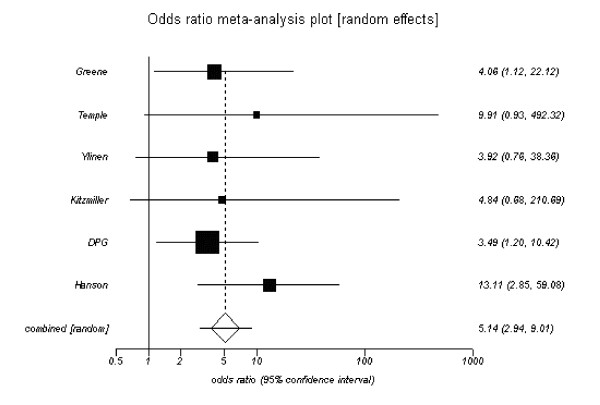
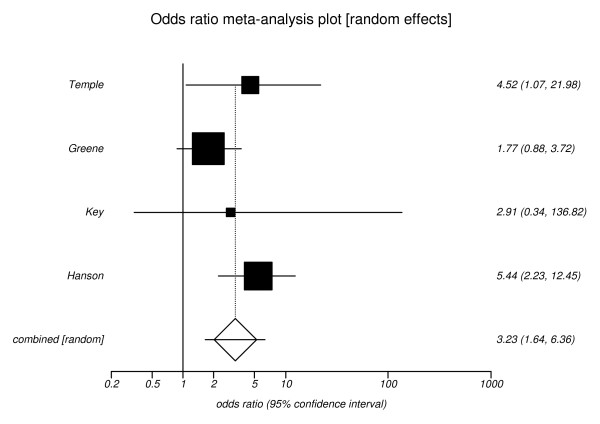
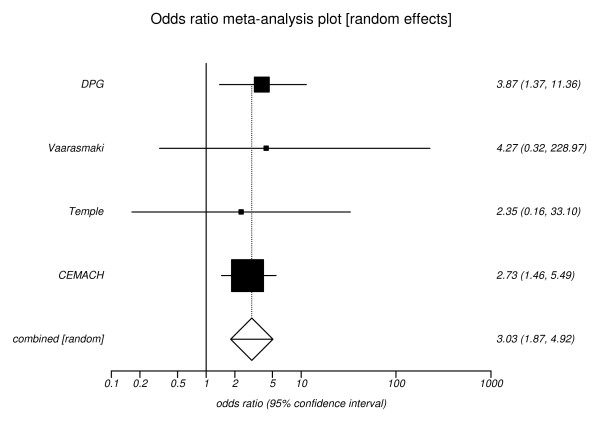
Results: The review identified thirteen studies which compared poor versus optimal glycaemic control in relation to maternal, fetal and neonatal outcomes. Twelve of these studies reported the outcome of congenital malformations and showed an increased risk with poor glycaemic control, pooled odds ratio 3.44 (95%CI, 2.30 to 5.15). For four of the twelve studies, it was also possible to calculate a relative risk reduction of congenital malformation for each 1-percent decrease in HbA1c, these varied from 0.39 to 0.59. The risk of miscarriage was reported in four studies and was associated with poor glycaemic control, pooled odds ratio 3.23 (95%CI, 1.64 to 6.36). Increased perinatal mortality was also associated with poor glycaemic control, pooled odds ratio 3.03 (95%CI, 1.87 to 4.92) from four studies.
Conclusion: This analysis quantifies the increase in adverse pregnancy outcomes in women with diabetes who have poor glycaemic control. Relating percentage risk reduction in HbA1c to relative risk of adverse pregnancy events may be useful in motivating women to achieve optimal control prior to conception.
Figures
References
-
- Janz NK, Herman WH, Becker MP, Charron-Prochownik D, Shayna VL, Lesnick TG, Jacober SJ, Fachnie JD, Kruger DF, Sanfield JA. Diabetes and Pregnancy. Factors Associated With Seeking Pre-Conception Care. Diabetes Care. 1995;18:157–65. - PubMed
LinkOut - more resources
Full Text Sources
